Fig. 1.
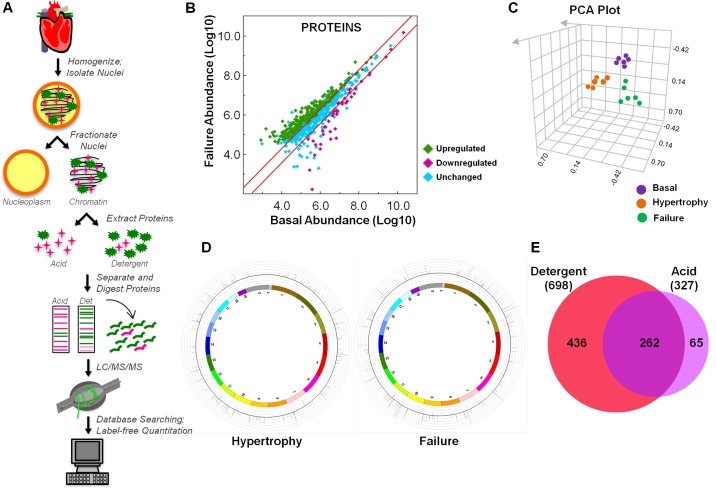
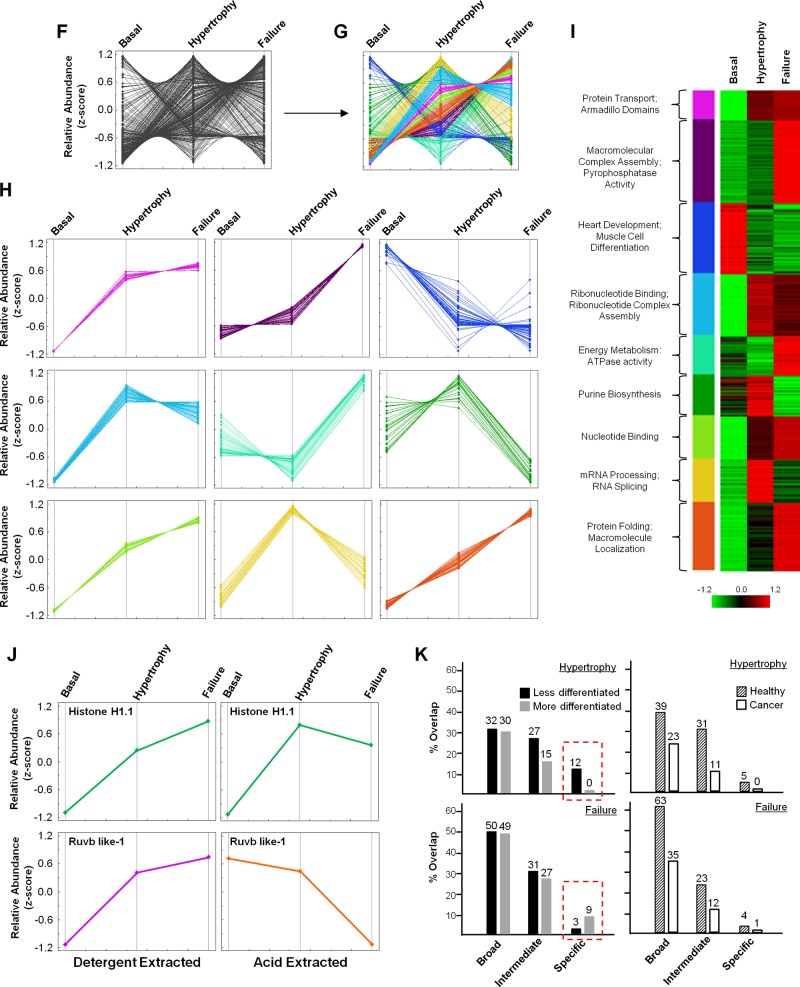
Proteomic quantification of chromatin proteins in murine heart. A: schematic workflow of mass spectrometric identification of mouse chromatin proteins and label-free quantitation. In this study, loosely associated chromatin proteins were isolated using detergent (as opposed to tightly bound proteins which can be isolated only in the presence of low pH, referred to as “acid-extracted proteins” in the figure and text) to investigate proteins capable of transient regulation of the genome during stages of cardiac hypertrophy and failure. B: peptides identified by mass spectrometry were mapped to proteins and relative quantitation determined using the Elucidator software program. Proteins increasing in abundance during the failure stage are shown as green diamonds, those decreasing as purple diamonds, and those unchanged (or not statistically significant) as blue diamonds. Red lines indicate 2-fold change. C: the reproducibility of peptide abundance changes from basal, hypertrophied, and failing hearts was calculated using ANOVA on the 6 replicates (in each of the 3 conditions) and principal component analysis (PCA) performed. D: all proteins whose abundance was found to change in stages of hypertrophy or failure by 2-fold or greater were mapped to their chromosomal location, with relative change in abundance indicated by the inflection of the lines (toward the center being downregulated, and toward the outside being upregulated), each of which corresponds to a single protein. E: all proteins identified in this study were compared to proteins identified from our recent analysis of acid-extracted chromatin (13) using a Venn diagram to display overlap in the two datasets; note that the majority of proteins identified in the present study are distinct from our previous analysis, supporting this fractionation approach as having revealed a biologically distinct pool of proteins. F: to identify groups of proteins with similar changes in abundance, we converted relative abundance values to Z-scores, with each protein displayed as a single line, and performed unsupervised clustering (G) based on similar quantitative behavior during disease. H: the nine resulting modules contain proteins with corresponding changes in abundance. I: gene ontology (GO) analysis of each module—rendered in this panel as a heat map—highlights biological processes and molecular functions enriched in each module. J: changes in protein abundance across disease states were compared between the two chromatin compartments [detergent (this study) vs. acid-extraction (13)], with some proteins (Histone H1.1) showing the same pattern in both fractions, while others (Ruvb like-1) behaved differently. K: we also performed GO term enrichment analysis in which proteins differentially regulated in hypertrophy or failure chromatin were compared to proteins differentially regulated in published datasets from more or less differentiated cells or cancer or healthy tissue to determine if biological processes involved in heart disease are more similar to either cancer or development (see Supplemental Table 4, available with the online version of this article). To compare these subproteomes, we examined the “biological process” term set, with that grouping being the broadest categorization; we subdivided other more discriminating terms into “intermediate” or “specific” as informed by their tier in the ontological tree. While processes enriched in either hypertrophic or failing chromatin had greater overlap with healthy processes, as opposed to cancer (right panels), when comparing the most specific processes (red boxes), we observed that hypertrophy shares more common processes with less differentiated cells while failure better matches more differentiated cells (left panels).


