
Figure 3.
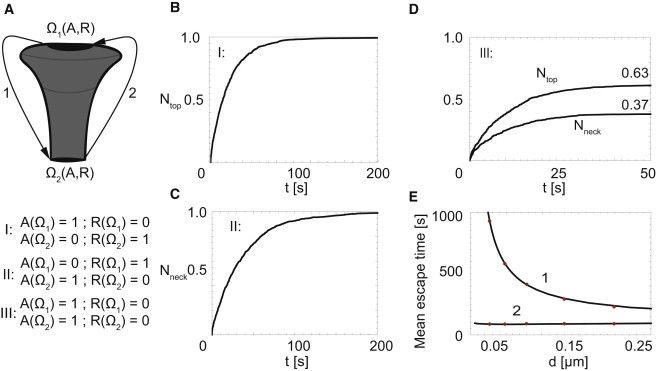
Shape-dependent asymmetry between capture and leakage dynamics. (A) A spinal surface, consisting of two equally sized absorbing regions, one at the base of the neck and one at the top of the spine (R = 1 μm, B = 4 μm, d = 0.12 μm, D = 0.1 μm2/s; see Fig. 1C). (B–D) At t = 0, the local receptor concentration is homogeneously distributed over the surface of the spine. (B) Time-evolution of capture at Ω1 upon rendering this region absorbing. (C) Time-evolution of capture at Ω2 upon rendering this region absorbing. (D) Time-evolution of capture at Ω1 and Ω2 upon rendering both regions absorbing. (E) Neck-size dependence of the mean escape time of receptors released at the reflecting boundary Ω1 (1) or Ω2 (2) and captured by the absorbing boundary Ω2 (1) or Ω1 (2), respectively. (Dots) Simulation results; (continuous line) analytical results based on MFPT. To see this figure in color, go online.