
Figure 1.
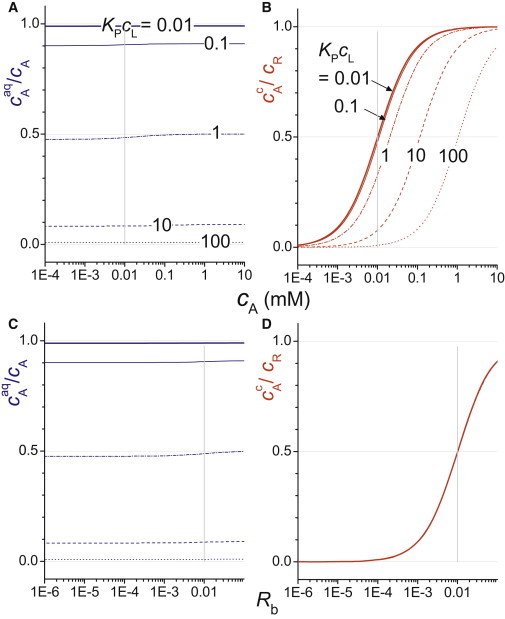
(A and C) Fraction of additive that is in aqueous solution, cAaq/cA (blue), and (B and D) fractional occupancy of the receptor, cAc/cR (red), as functions of the total ligand concentration, cA (top), and the additive/lipid mole ratio in the membrane, Rb (bottom). Simulations were done for KP = 1 mM−1, KD = 10 μM, cR/cL = 1:1000, and cL = 0.01 mM (bold solid), 0.1 mM (thin solid), 1 mM (dash-dot), 10 mM (dashed), or 100 mM (dotted line).