
Figure 2.
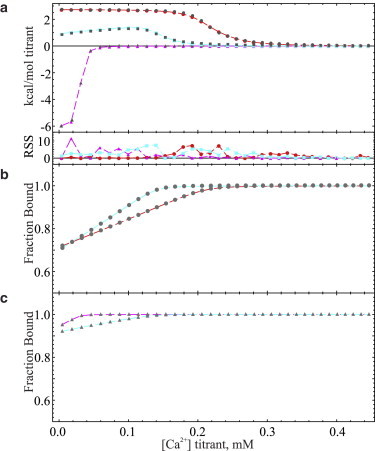
(a) Baseline-corrected titration isotherms (solid symbols) and ODE-based simulations (traces) of calcium binding to solutions of 1.131 mM 5,5′-dimethylBAPTA and 564.7 μM of added Ca2+ (solid gray circles with red traces,) 589.4 μM EDTA and 541.2 μM of added Ca2+ (solid triangles with magenta traces,) and a 50/50 v/v mixture of each chelator solution with 553 μM of added Ca2+ (solid gray squares and cyan traces.) All titration isotherms were conducted in pH 7.4, 25 mM HEPES, 150 mM KCl buffer at 25°C with 8 μL injections of 2.5 mM Ca2+ as titrant. Calculated fraction of macromolecule bound versus added Ca2+ titrant for (b) 5,5′-dimethylBAPTA-containing samples and (c) EDTA-containing samples using parameters derived from fitted isotherms and denoted by associated symbol shapes and trace color. All fitted isotherms were generated and manually fit using the ordinary differential equation (ODE) approach and a single binding site (EDTA) or a single binding site with a fraction (4.9%) dedicated to a second binding site to represent impurities (5,5′-dimethylBAPTA) and separate parameters to describe residual ligand, macromolecule purity, binding enthalpy, and affinity. A correction of 2.4% was applied to the total macromolecular concentration in the simulation for the sample representing the 50:50 v/v mixture to account for an apparent offset in the independent axis, albeit minor, of the simulated data from the experimental isotherm.