
Figure 4.
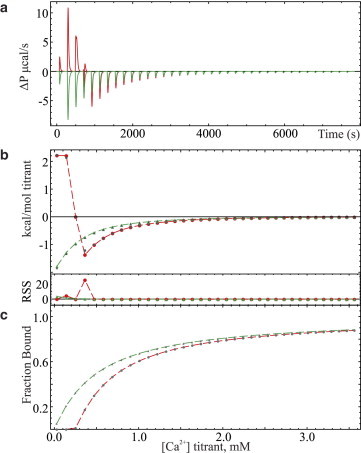
(a) Raw titration calorimetry data of calcium binding to 97 μM hPC2-EF protein with 350 μM 5,5′-dimethylBAPTA (red traces) and without chelator (green traces) in pH 7.4, 25 mM TRIS, 150 mM KCl buffer with 1 mM TCEP at 25°C using 8-μL injections of 20 mM Ca2+. (b) Simultaneously fitted, baseline-corrected isotherms of (a) with chelator (red traces) and without chelator (green traces) and with residual sum-of-squares (RSS) error in fitting depicted at the base of the panel. (c) Calculated fraction of 15N hPC2-EF protein bound to titrant in each sample.