
Figure 1.
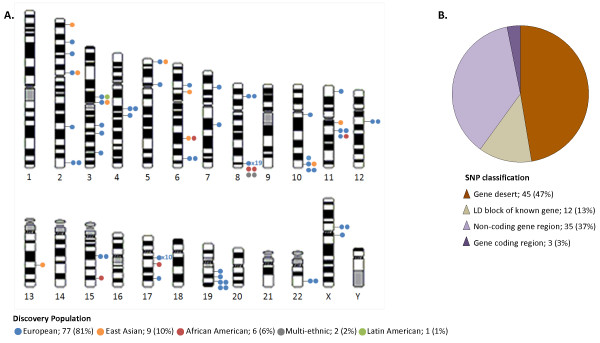
Current content of prostate cancer risk alleles. (A) Chromosomal distribution and discovery population of published prostate cancer risk alleles achieving genome-wide significance (P-value < 10-6). Each dot represents one single nucleotide polymorphism (SNP), except where a numerical value indicates the number of SNPs that dot represents (applicable to regions 8q24 and 17q12). Dots are color coded to represent the discovery population of each SNP. (B) Classification of each SNP represented in Figure (A), relative to known, characterized genes.