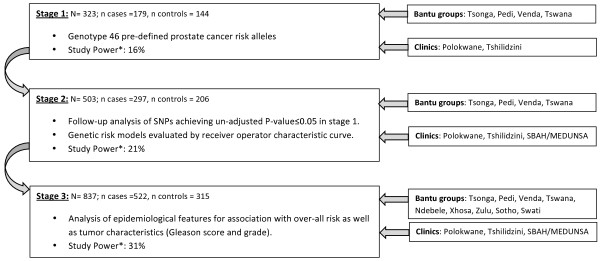
Figure 2.

Stages 1 to 3 of SAPCS data analysis. Depicting study size, study inclusion (Bantu population groups and participating urological clinics), data analysis and study power at first three stages of SAPCS collection. *Study Power represents power to detect an OR = 1.4, given a probability of exposure in controls = 0.1 in single hypothesis testing.
