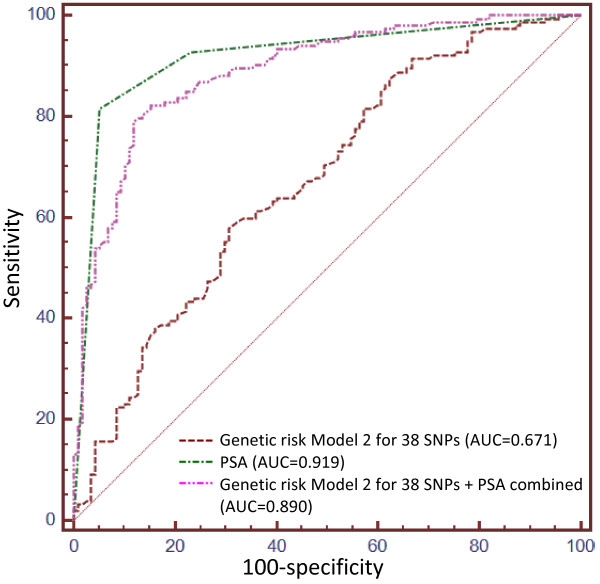
Figure 3.
Receiver operating characteristic (ROC) curves for genetic risk model 2 compared to PSA levels alone and combined with genetic risk model. Genetic risk model 2 for 38 SNPs results in an AUC of 0.671. PSA levels more accurately predict prostate cancer occurrence in the SAPCS study population with an AUC of 0.919 (difference between areas = 0.248, 95% CI 0.176-0.319, P < 0.0001). The predictive power of PSA was not improved when combined with genetic risk model 2 for 38 SNPs (AUC = 0.890, difference between areas = 0.0292, 95% CI -0.003-0.062, P = 0.0784).

