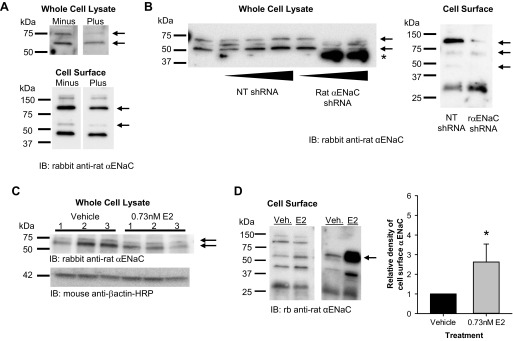
Fig. 3.

E2 increased cell surface abundance of cleaved αENaC in L2 cells. A: we first assessed the specificity of the αENaC antibody to proteins of interest in whole cell and cell surface lysates from L2 cells using antigen competition. In whole cell lysates, the antibody detected ∼75- and 60-kDa bands (−), both of which were decreased by the presence of the immunizing antigen (+). For cell surface lysates, the antibody detected 150-, 95-, 60-, and 47-kDa bands (−). The ∼95- and 60-kDa bands decreased in intensity in the presence of the immunizing antigen (+). B: to further confirm the specificity of the antibody, we transfected cells with a control nontargeting (NT) short-hairpin RNA (shRNA) or a rat αENaC shRNA to knock down protein levels of αENaC specifically. The αENaC shRNA eliminated the 75-kDa band and reduced the 60-kDa band in whole cell lysates and reduced the 95- and 60-kDa bands in cell surface extracts. C: we next examined the total protein abundance of αENaC in whole cell lysates from L2 cells treated with vehicle or E2 overnight. There were no significant differences in the 75- or 60-kDa bands. D: using cell surface biotinylation, we examined the apical plasma membrane abundance of αENaC in L2 cells treated with vehicle (Veh) or E2 overnight. Representative blots are shown with an arrow that denotes the band of interest. Densitometry revealed a significant increase in the density of the ∼60-kDa band of αENaC in E2-treated groups compared with vehicle (n = 5). Data are shown as means ± SE. *P < 0.05 vs. vehicle by z-test.
