
Fig. 1.
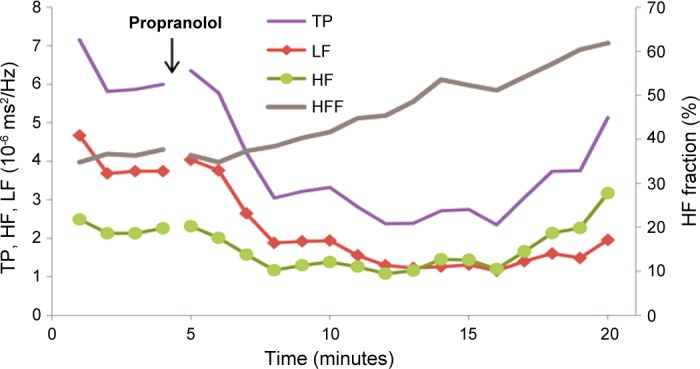
Time course of the changes in total power (TP), high-frequency fraction (HFF), and low-frequency (LF) power and high-frequency power (HF) components of the power spectrum in response to propranolol. ECGs were monitored in 4-mo-old male mice. Four days after mice had recovered from surgery, heart rate (HR) was recorded continuously for 5 min before and 15 min after the intraperitoneal injection of 1 mg/kg propranolol. Composite plots of TP (TP = HF + LF), HFF [HFF = HF/(HF + LF)], LF, and HF were obtained as described in materials and methods.