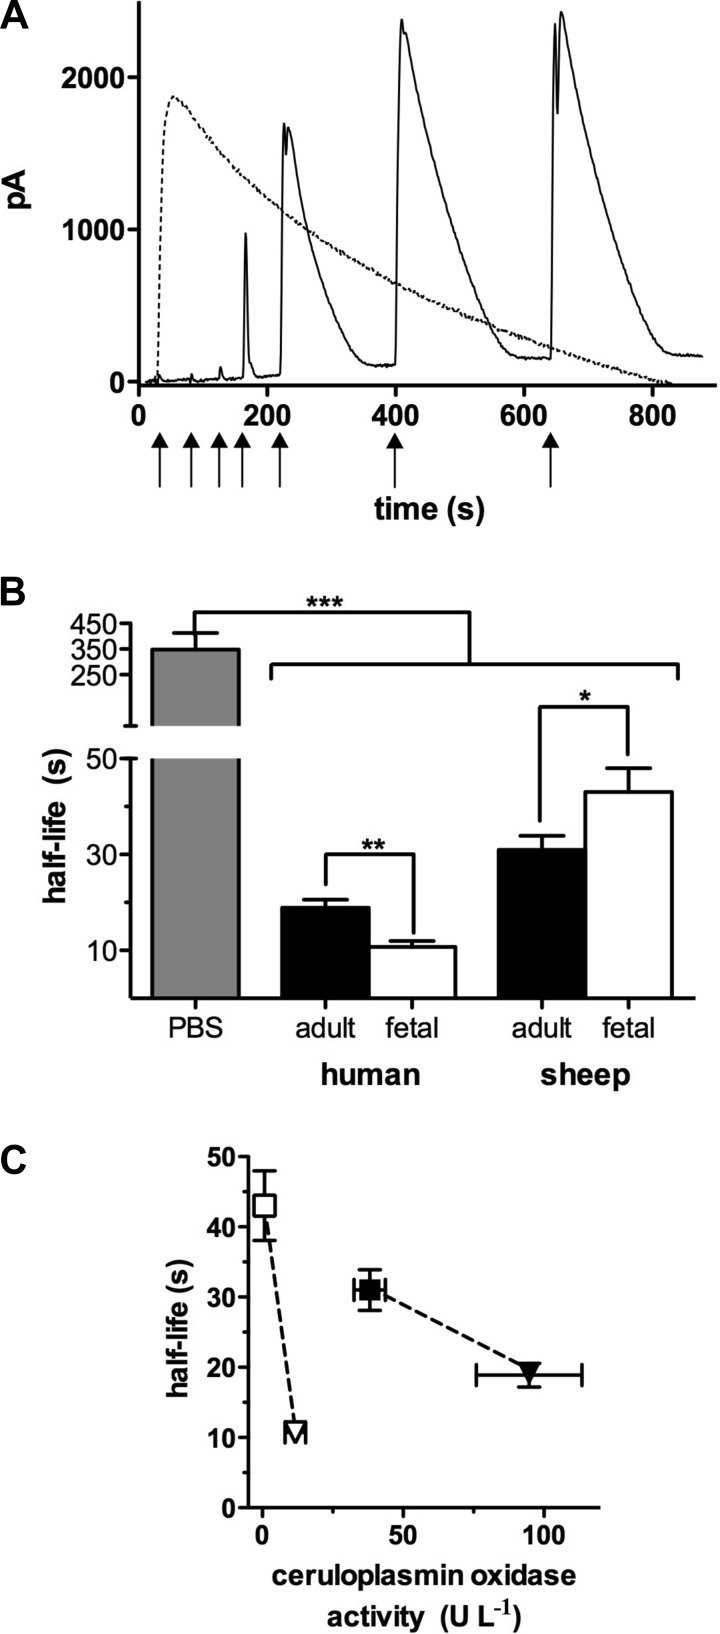
Fig. 2.
Nitric oxide (NO) disappearance curves. A: representative example of NO disappearance curves in PBS (dashed black line) and in native plasma (fetal sheep; black line). In PBS, injection of 1.5 μM NO (↑) immediately resulted in a full peak with a half-life of ∼350 s. In plasma, three injections of NO (each to achieve an initial NO concentration of 1.5 μM) were required before the probe current rose distinctly at the 4th injection. Starting with the 6th injection, probe responses were uniform, with an elimination half-life significantly shorter than in PBS. Plasma thus exhibits a distinct, fast and saturatable NO-metabolizing capacity (fast mode) not measurable with the amperometric probe. B: apparent t1/2 of NO in plasma from all groups, determined at full peak, was significantly shorter than in PBS (n = 6, P ≤ 0.0001), with an average rate of disappearance 17.5 ± 5.4 times faster in plasma than in PBS. The t1/2 of NO in human fetal plasma was significantly shorter than in human adult plasma (n = 5 and 6, respectively, P ≤ 0.005), whereas in sheep the t1/2 was significantly shorter in maternal plasma than in fetal plasma (n = 12 for both, P ≤ 0.05). C: there is no significant overall relationship between the plasma half-life of NO and ceruloplasmin oxidase activity (r = −0.36; P = 0.64) but within the group of fetuses (□, ▽) and adults (■, ▼), half-lives are higher at lower ceruloplasmin activities. Dashed lines highlight the comparison of the fetal and adult samples between species. *P ≤ 0.05, **P ≤ 0.005, and ***P ≤ 0.0001.

