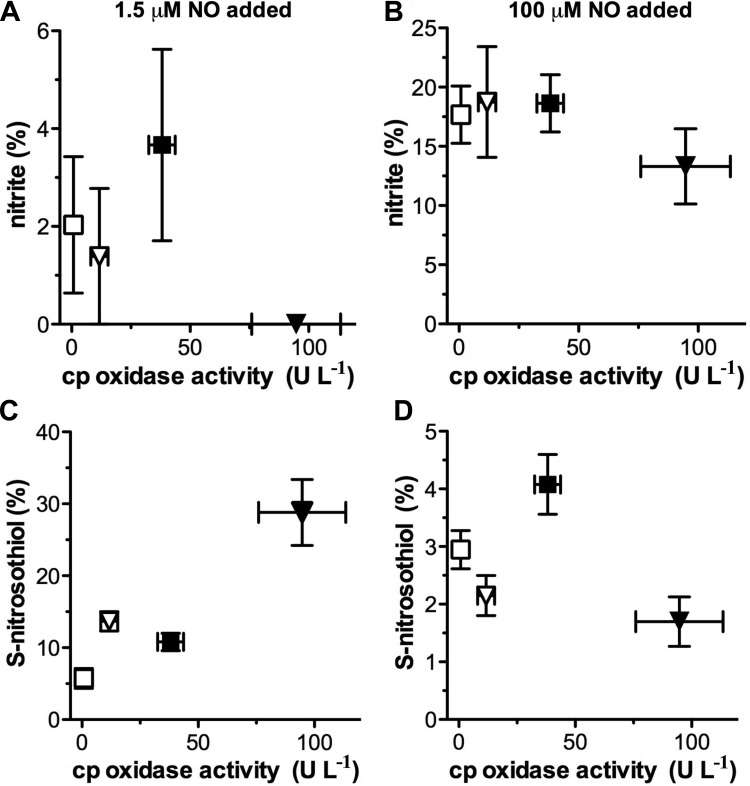
Fig. 5.
Relationship between ceruloplasmin (cp) oxidase activity and nitrite and SNO formation during the fast (A and C) and slow (B and D) NO reaction mode. Ceruloplasmin oxidase activity (Fig. 1C) is plotted against yields of nitrite and SNO (Fig. 3, B and D). There was no significant correlation between nitrite production and ceruloplasmin activity following addition of either 1.5 μM (A) or 100 μM NO (B). There was also no significant correlation between ceruloplasmin activity and SNO production following addition of 100 μM NO (D). However, SNO production was significantly correlated with ceruloplasmin activity following addition of 1.5 μM NO (C; r = 0.92, P = 0.04). Notably, this is associated with an absent nitrite production (cf. Figs. 3B and 5A) at high oxidase activity values. Symbols indicate sheep: fetal (□) and adult (■); and human: fetal (▽) and adult (▼).

