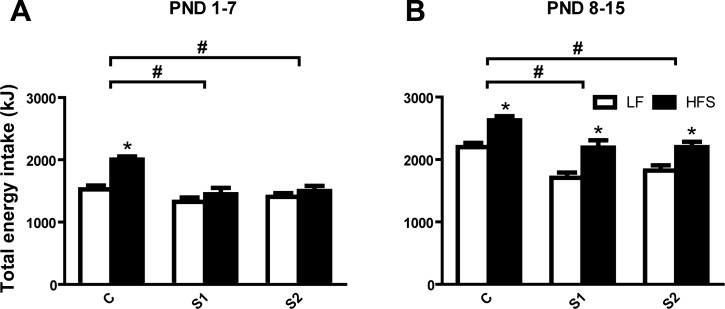
Fig. 3.
Total energy intake (kJ) of LF (open bars) and HFS (solid bars) feeding lactating dams during the first week (PND 1–7; A) and second week (PND 8–15; B) after parturition in control (C) and selected (S1, S2) lines. Tukey post hoc test: *P < 0.05, diet; #P < 0.05, S1 or S2 vs. C. Values are expressed as means ± SE.

