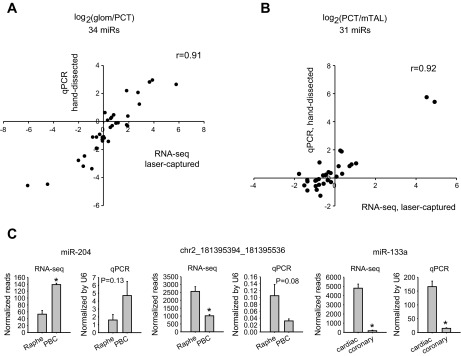
Fig. 2.

MicroRNA (miRNA, also miR) abundance ratios obtained by deep sequencing of minute amounts of laser-captured specimens were highly consistent with those obtained by real-time PCR analysis of hand-dissected or laser-captured specimens. A: glomeruli-proximal tubule ratios. The segments were hand-dissected. B: proximal tubule-mTAL ratios. The segments were hand-dissected. The real-time PCR (qPCR) data in A and B were taken from Ref. 20. See Ref. 20 for a detailed description of the qPCR experiment. C: additional qPCR validation using individual laser-captured specimens. PBC, pre-Bötzinger complex. N = 6 for qPCR. *P < 0.05 vs. the other tissue in the graph.
