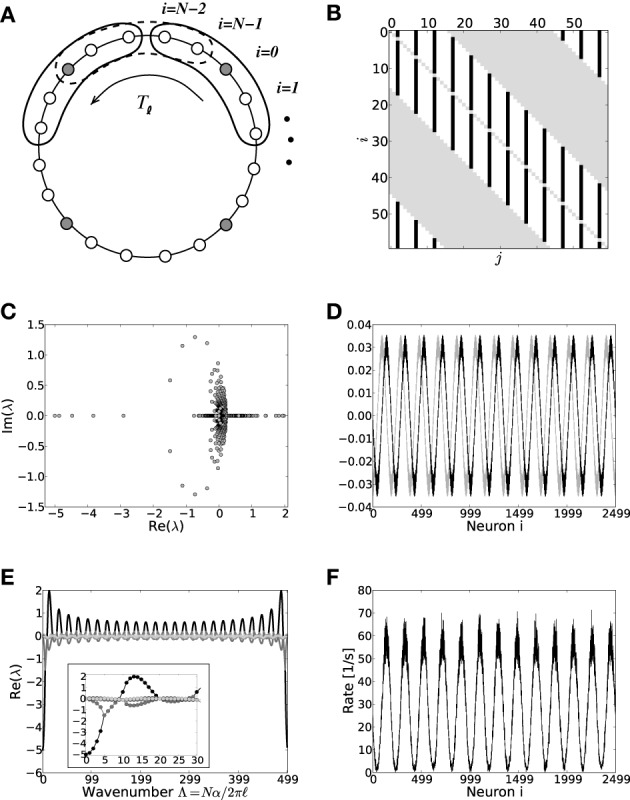
Figure 3.

(A) Sketch of the neuron layout on the ring topology. Each neuron is connected to its κ nearest neighbors. A shift in neuron label by five yields the same ring as before and is formally expressed by the shift operator Tℓ with ℓ = 5. (B) Shows the coupling matrix W of the ring: black squares depict inhibitory, white squares excitatory, and gray squares zero coupling from j to i (N = 60, κ = 30). (C) Eigenvalue spectrum of a ring matrix W/θ with N = 2500, κ = 250, J = 1 mV, and g = 6. (D) The two eigenvectors belonging to the twice degenerated eigenvalue from (C) with largest real part λc. (E) The eigenvalues form five bands and are shown as a function of the wavenumber. The black curve depicts the band containing the critical (maximal) eigenvalue λc which here corresponds to wavenumber Λc = 13, so the two crictical eigenvectors have 13 major peaks (cf. D,F). (F) The rate as a function of the neuron index in a simulation of N = 2500 integrate-and-fire neurons with J = 1 mV and Ix = 750 pA. Note that the spectra (shown in C) look slightly different in the fluctuation-driven case, because the absolute amplitude of the entries |ij| ≠ |Wij|, and also the balance between positive and negative entries ≠ g. The maximum of the dispersion relation and the eigenvectors are, however, the same.
