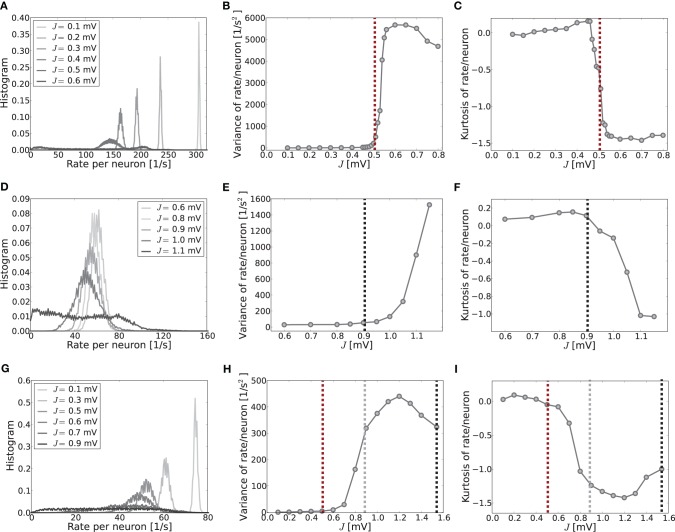
Figure 5.
The histograms of rates, variance and kurtosis for various weights J in a network of N = 2500, κ = 250, and g = 6 averaged over 10 trials. (A–C) Shows the mean-driven case (Ix = 2500 pA delivered as Poisson noise with external synaptic strength Jx = 0.1 mV), (D–F) the fluctuation-driven case (Poisson noise adapted s. t. μ[RI] = 5 mV and σ[RI] = 60 mV) and (G–I) an intermediate case, where the external input was Poisson noise (current-amplitude 875 pA, Jx = 0.1 mV). For subcritical J < Jc the distributions are approximately Gaussian with small variance and kurtosis close to zero. For supracritical weight the distributions become broader and platykurtic, indicated by the negative kurtosis. The vertical dashed lines in (B,C) and (E,F) mark the respective critical weights, i.e., Jc = 0.506 mV [red, using Equation (13)] for the mean-driven, and Jc = 0.905 mV for the strongly fluctuation-driven case [black, using Equation (9)]. The dashed vertical lines in (H,I) mark the respective predictions for the critical weight by Equation (13) (red, independent of η), and by Equation (9) with only the contribution of ∂ν/∂μ (gray) and both linear and quadratic contributions ∂ν/∂μ, ∂ν/∂σ (black) for the estimation of the effective coupling strengths, cf. Equation (7b). The increase in the kurtosis and decrease in the variance for very large J in (B,C) and (H,I) is due to the rectification of rates that leads to increasing mass at zero. Note that sampling is denser around the expected Jc-value in the first two rows.

