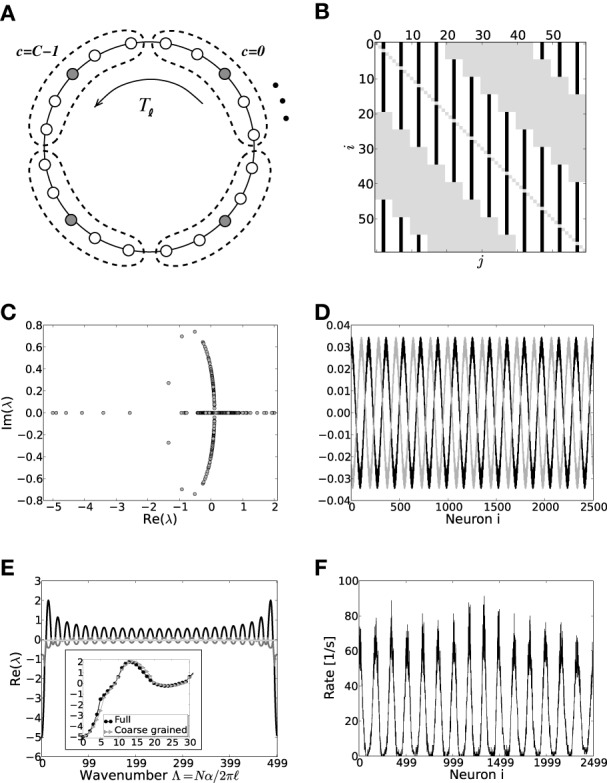
Figure 7.

(A) Sketch of the layout of the coarse-grained system. Each neuron is connected to the L − 1 other cells within its cell and to all neurons in its 2K nearest cell neighbors. A shift in neuron label by five yields the same ring as before and is formally expressed by the shift operator Tℓ with ℓ = 5. (B) Shows the coupling matrix W of the ring: black squares depict inhibitory, white squares excitatory, and gray squares zero coupling from j to i (N = 60, κ = 30). (C) Eigenvalue spectrum of a scaled ring matrix W/θ with N = 2500, κ = 250, and g = 6. (D) The two eigenvectors belonging to the twice degenerated eigenvalue from (C) with largest real part, λmdc. (E) Five bands of eigenvalues as a function of the wavenumber. The black line depicts the band containing λmdc. The inset shows the critical bands of the system in section 3.2 (black circles, cf. also Figure 3) vs. the critical band in the coarse-grained system (gray triangles). The critical wavenumber differs by one. (F) The corresponding rate per neuron in a simulation of N = 2500 integrate-and-fire neurons with J = 1 mV and Ix = 750 pA.
