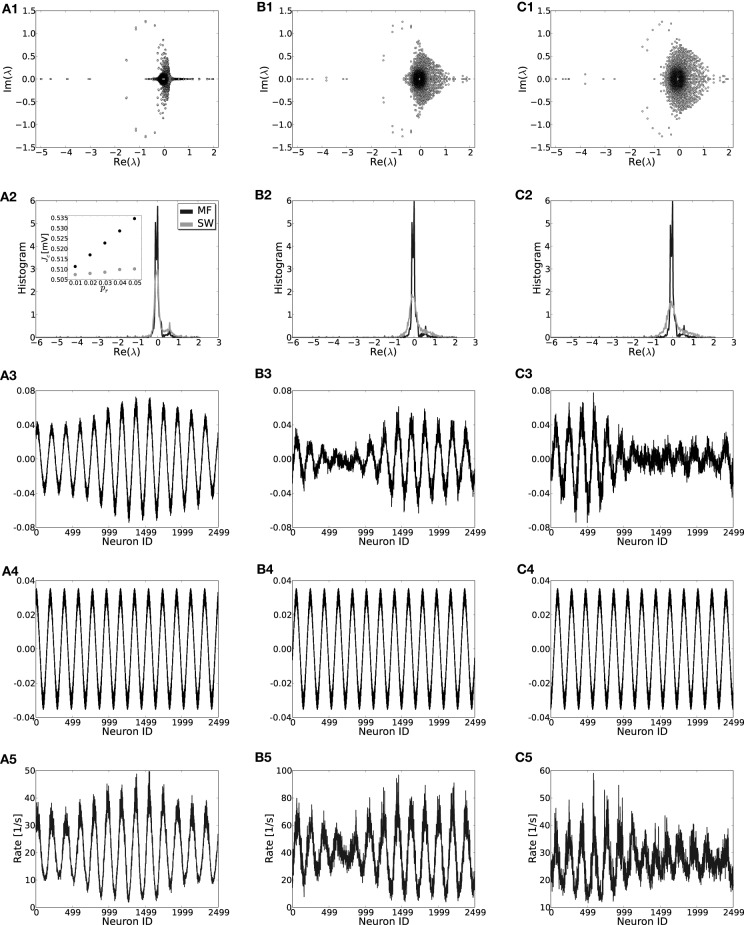
Figure 8.
Effect of rewiring of edges on the eigenvalue distributions (row 1), the mean-field density of the real parts of eigenvalues (row 2), the crictical eigenvectors of the specific realization (row 3) and the mean-field system (row 4) and the rate per neuron (row 5) in small-world networks for three different rewiring probabilities pr = 0.01, 0.03, 0.05 in (A,B,C), respectively (cf. Watts and Strogatz, 1998; Kriener et al., 2009). While in (A3,B3) it is the dominant eigenmode vc that correlates strongest with the actual rate distribution [(A5,B5), Pearson correlation coefficients of c = 0.967 and c = 0.945, respectively], in (C3) the linear combination of the two leading eigenvectors correlates best with the actual rates [(C5), vc has c = 0.68 while the combination of the two leading modes gives c = 0.91]. The inset in (A2) shows the estimate for the critical weight Jc as a function of pr in the mean field model (MF, black) and as an average of 50 network realizations (SW, gray). Parameters: N = 2500, J = 1 mV and Ix = 750 pA. During rewiring the number of excitatory and inhibitory inputs was kept constant.

