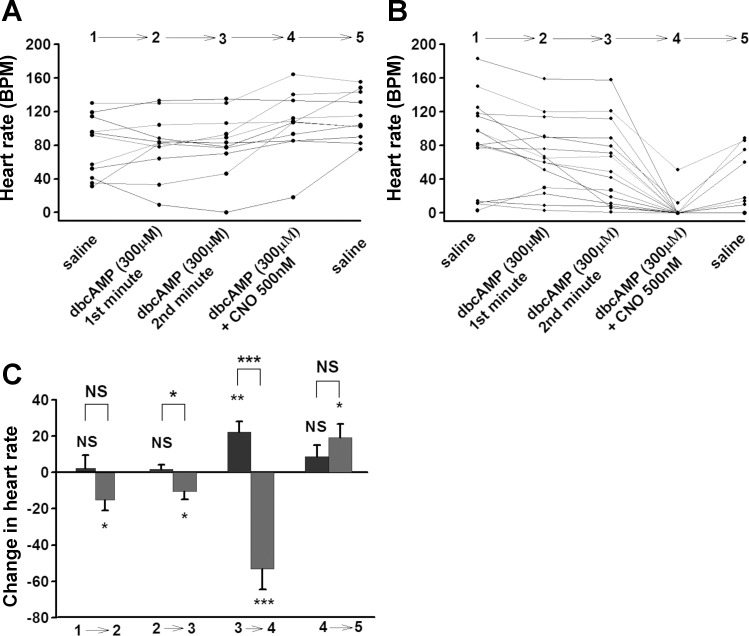
Fig. 11.
Effect of dbcAMP and dbcAMp+CNO combination on larval heart rate. A: Background UAS-M4D, n = 11. B: UAS-M4D X 24B-GFP, n = 15. C: Comparison between background (dark grey) and M4D expressing group (light grey). The differences between genotypes are represented by NS (not significant) or asterisk(s) above the line. The differences, which are due to changing one solution with another one in the same genotypes, are represented by NS or asterisk(s) above the bars. P ≤ 0.05 (*), P ≤ 0.02 (**), P ≤ 0.001 (***).

