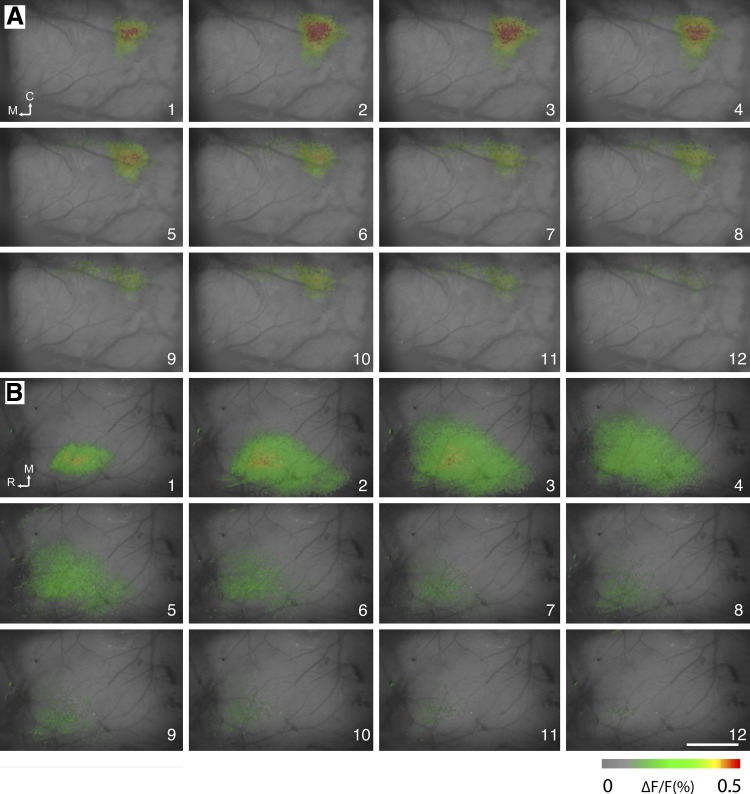
Fig. 8.
Voltage-sensitive dye optical images from layer III-IV border (200-μm depth from the surface) of the barrel cortex following E2 whisker stimulation. Fluorescence changes (ΔF/F) are shown in pseudocolors in series of frames from control (A) and in CxNR1KO (B) mice. The stimulus onset was at the beginning of frame 1. Frame number is indicated at the bottom right corner of each image. Duration of each frame is 5 ms. Calibration bar is 1 mm. C, caudal; M, medial; R, rostral.

