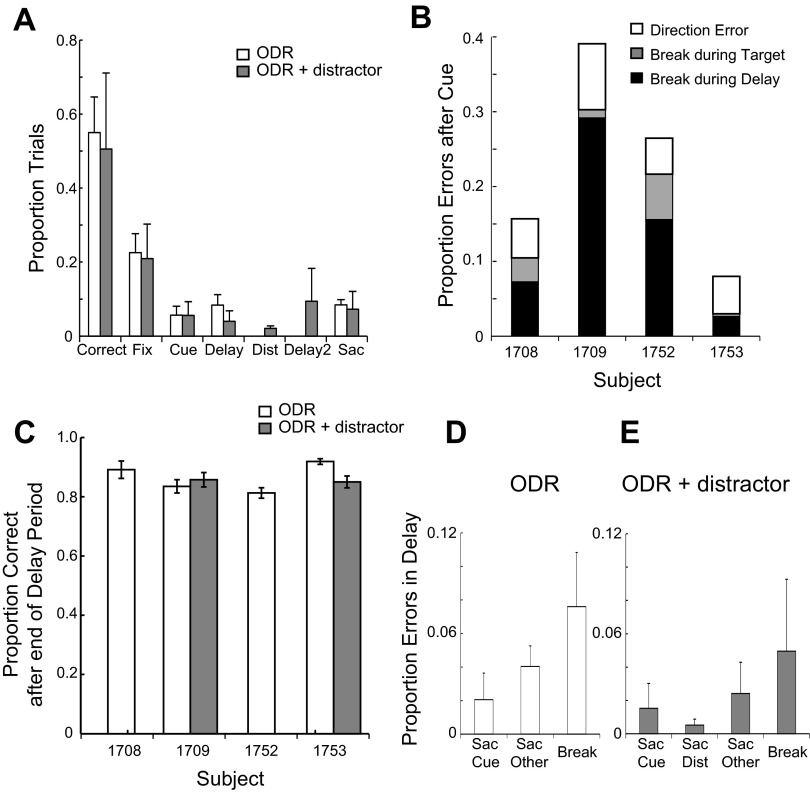
Fig. 3.
A: proportions of possible trial outcomes for the ODR and ODR with Distractor tasks. First 2 bars indicate correct trials in the 2 tasks. Subsequent bars indicate errors due to breaks in fixation during the initial fixation interval; errors during the cue presentation interval; errors during the delay interval; errors during the distractor presentation (in the ODR with Distractor task only); errors during the second delay period, following the distractor; and errors during the saccade interval. Mean values and SE are plotted across monkeys. B: proportions of errors after the cue presentation in the ODR task, separately for each of the monkeys. Types of errors plotted include directional saccade errors, where the monkey's eye movement was away from the cue location; target errors, where the monkey's eye movement was to the cue location but fixation was broken before the minimum time required to obtain a reward; and breaks in fixation during the delay period, prior to the offset of the fixation point, which instructed the animal to make a saccade. C: proportion of correct trials in the ODR and ODR with Distractor tasks, for trials that were completed up to the end of the delay period, shown separately for 4 monkeys. D: proportion of error trials during the delay period of the ODR task. Errors due to a saccade toward the cued location, errors due to a saccade to another location, and premature breaks in fixation at the target location are plotted. E: proportion of error trials during the second delay period (after the distractor) in the ODR with Distractor task. Errors due to a saccade toward the initial cue, errors due to a saccade to the distractor, errors due to a saccade to another location, and premature breaks in fixation at the target location are plotted.

