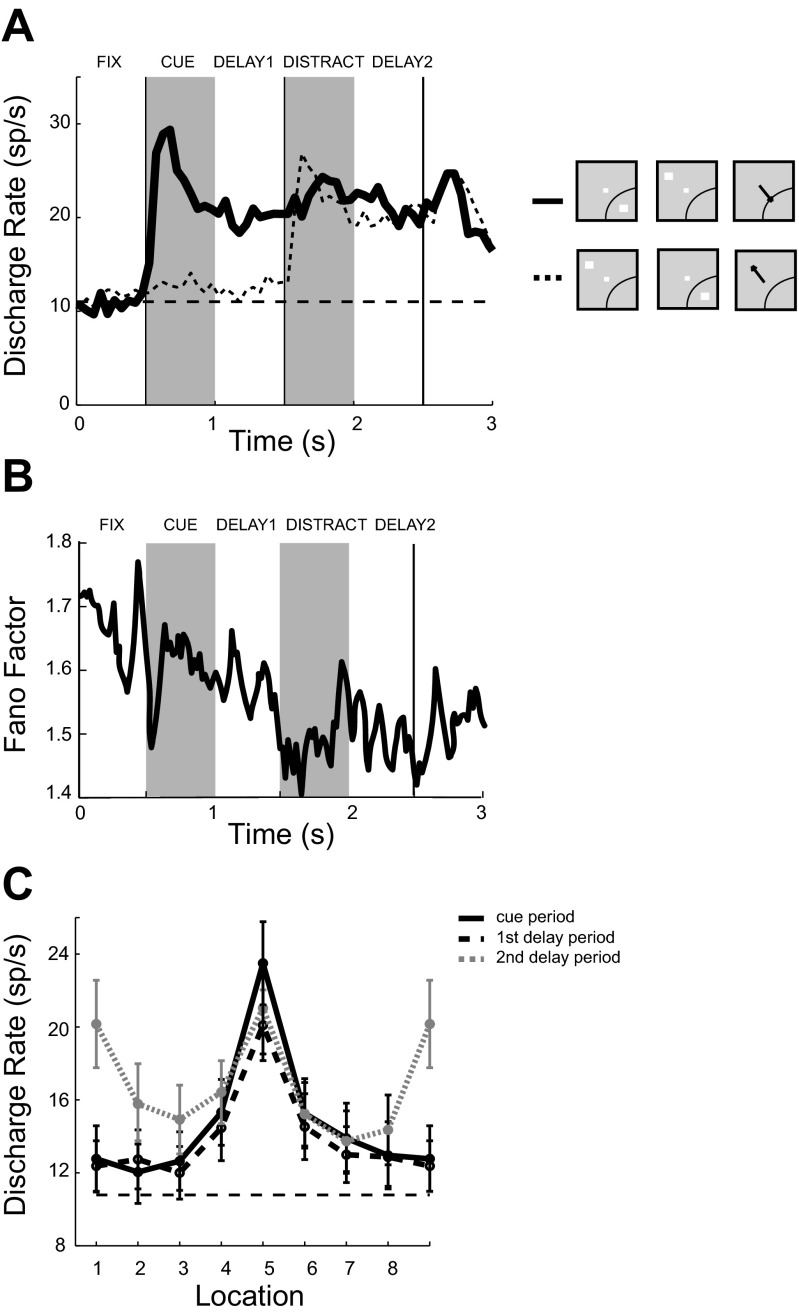
Fig. 8.
Population responses of neurons with significant delay activity in the ODR with Distractor task. A: population PSTH (n = 88 neurons) following the best cue location and diametric distractor location (solid line) or following the worst cue location and best distractor location (dotted line). Horizontal line represents baseline fixation discharge rate. B: mean Fano factor values of neuronal discharges during the trial. C: population tuning curves from the cue period, from the first delay, and from the second delay (after distractor presentation). Labels in A and B indicate fixation (FIX), cue presentation (CUE), first delay (DELAY1), distractor presentation (DISTRACT), and second delay (DELAY2) periods. Horizontal dashed lines in A and C represent the baseline firing rate.

