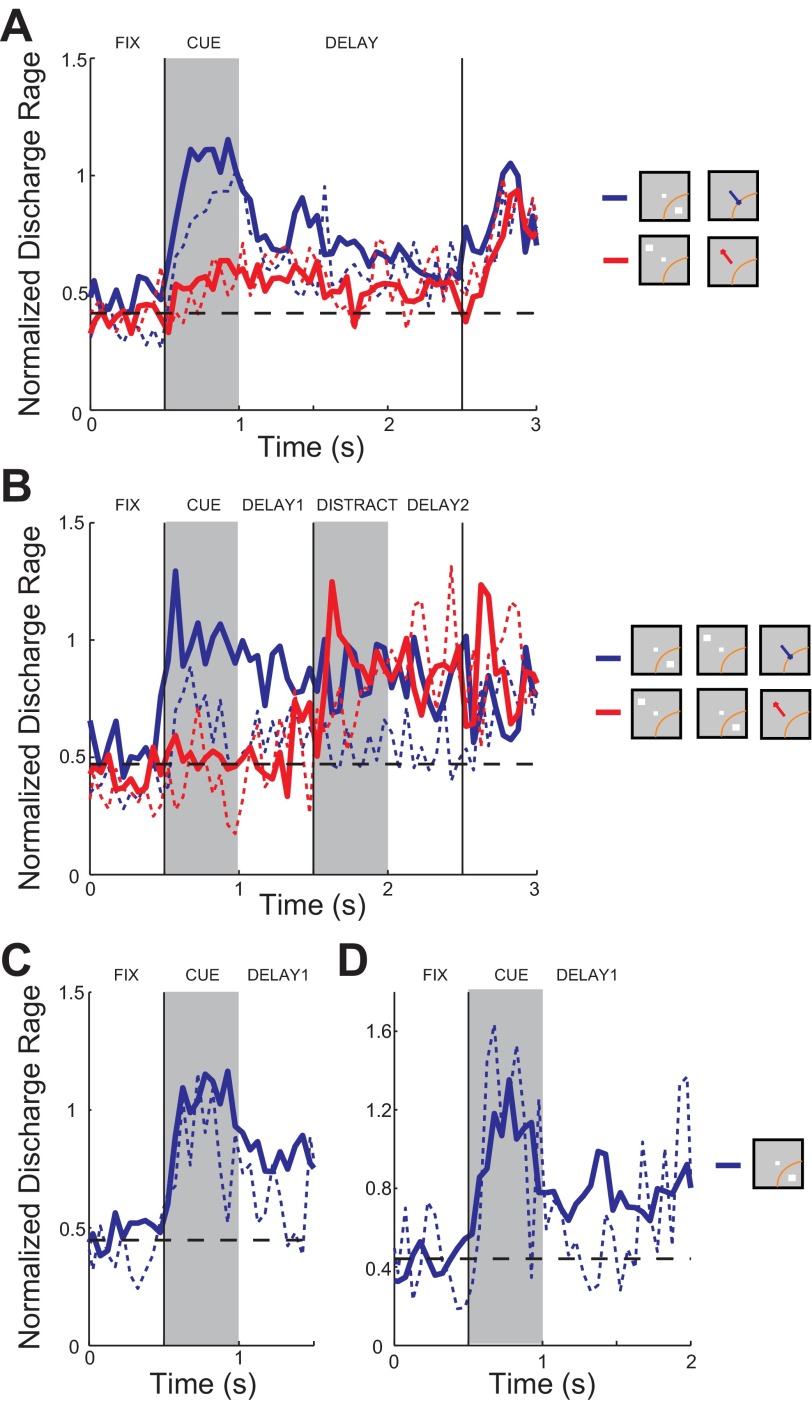
Fig. 9.
Neural activity in correct vs. error trials. A: population average firing rate from neurons with at least 2 error trials of any type in the ODR task. Normalized firing rate is shown in correct and error trials in which the cue appeared in the best location (blue traces, n = 43 neurons) and in the diametric location (red traces, n = 40 neurons). Solid and dashed lines indicate correct and error trials, respectively. B: population firing rate from the ODR with Distractor task. Averaged firing rate is shown in correct and error trials in which the cue appeared in the best location (blue traces, n = 10 neurons) and in the diametric location (red traces, n = 11 neurons). C: population firing rate in correct (solid) and error (dashed) trials aborted during the delay period. Error average is for all available trials in which a break in fixation occurred at least 0.5 s after the offset of the cue (n = 47 neurons). D: as in C but with error average for all trials in which an error occurred at least 1 s after the offset of the cue (n = 19 neurons).

