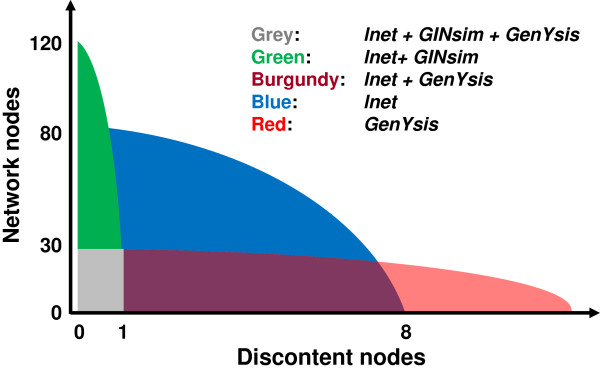
Figure 4.

Schematic comparison of the three algorithms. Colored regions indicate attractors that can be analyzed using any of the three tools GenYsis, GINsim and lnet. For the region in blue, attractors having at least one discontent node and more than 30 nodes overall, only lnet are applicable.
