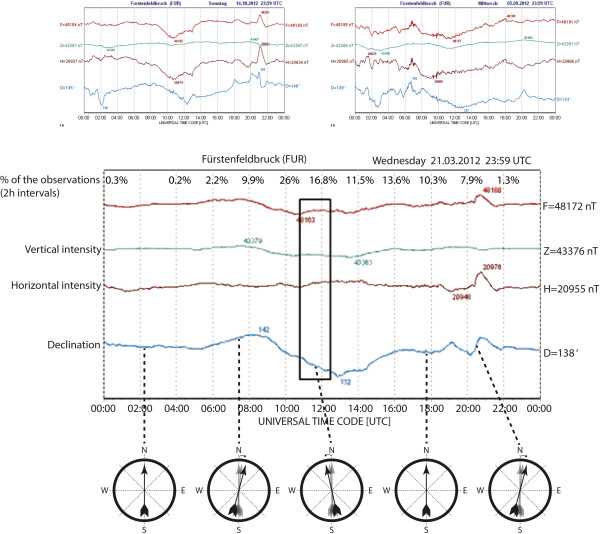
Figure 4.
An example of three typical daily magnetograms obtained from the Geomagnetic Observatory Fürstenfeldbruck (Munich, Germany): http://www.geophysik.uni-muenchen.de/observatory/geomagnetism F = total intensity, Z = vertical intensity, H = horizontal intensity, D = declination of the Earth’s magnetic field. In the given time period (marked by a rectangle in the lower graph), declination was changing westwards with the following rate: from 142 to 132 arch minutes in 240 time minutes = Difference of 10 arch minutes/240 min. = 4.2 %. The row of compasses illustrates the effect of the declination change in a highly exaggerated manner at different times of the day shown in the example. In reality, the changes in MF direction were much smaller. Note that even though the daily declination changes show some regularity (cf. ref. 22) they are not reliably predictable as illustrated by the frequent highly erratic changes, which are exemplarily shown in the two upper graphs.

