Figure 4.
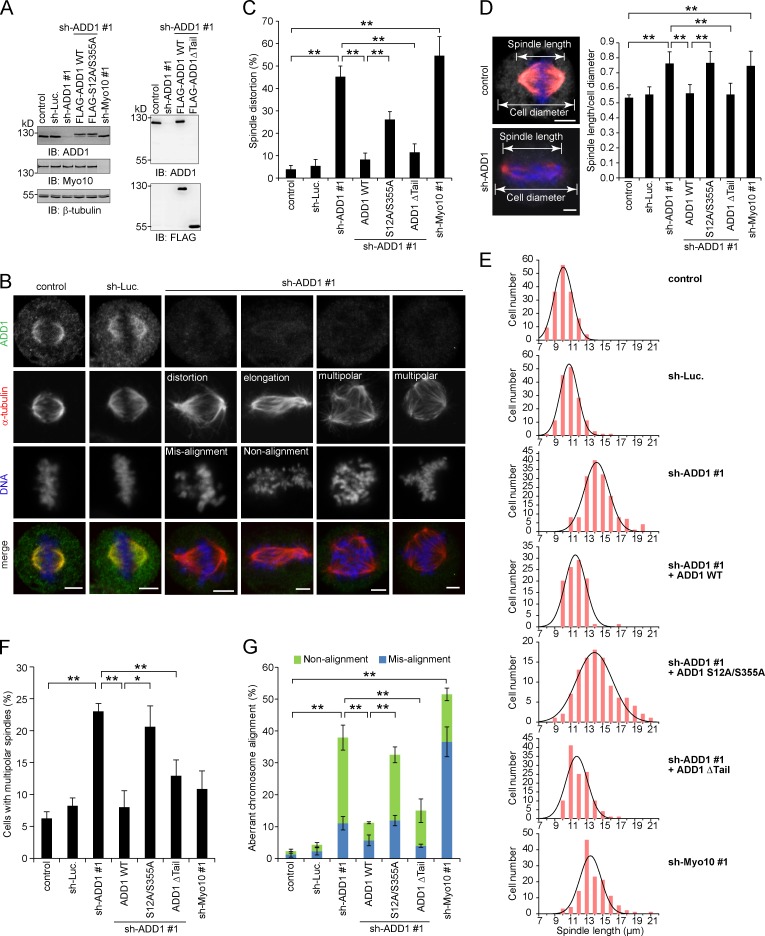
Depletion of ADD1 results in distorted, elongated, and multipolar spindles. (A) HeLa cells were infected with lentiviruses expressing shRNAs to ADD1 (shADD1 #1), Myo10 (shMyo10 #1), or luciferase (sh-Luc). FLAG-ADD1 or mutants (S12A/S355A and Δtail) were reexpressed in the cells whose endogenous ADD1 had been depleted. An equal amount of whole-cell lysates was analyzed by immunoblotting (IB) with the indicated antibodies. (B) The cells were stained for ADD1, α-tubulin, and DNA. (C) The percentage of distorted spindles in the total number of mitotic cells counted was measured (n > 700). (D) The cells were stained for ADD1 (gray), α-tubulin (red), and DNA (blue). The ratio of spindle length to cell diameter was measured (n > 90). (E) The spindle length of the mitotic cells was measured (n > 90). The results were obtained from three independent experiments. The best-fit Gaussian distribution is shown in the black curves. (F) The percentage of multipolar spindles in the total number of mitotic cells counted was measured (n > 700). (G) The percentage of aberrant chromosome alignment in the total number of mitotic cells counted was measured (n > 700). Values (means ± SD) are from three independent experiments. *, P < 0.05; **, P < 0.01. Bars, 5 µm.

