Figure 5.
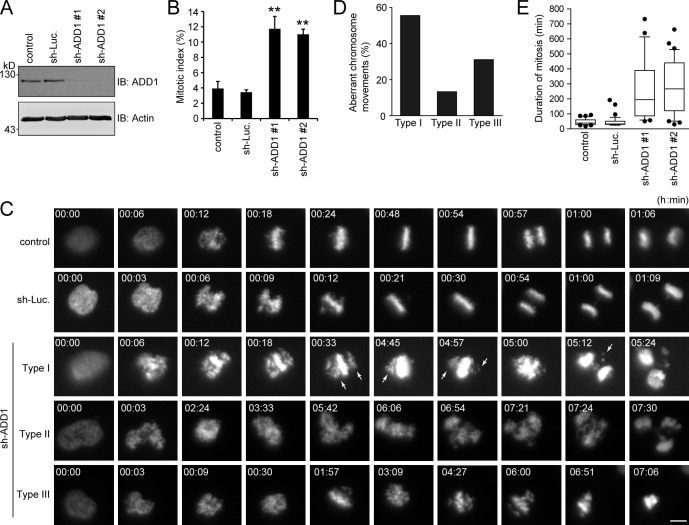
ADD1 depletion causes aberrant congression and segregation of chromosomes. (A) HeLa cells expressing mCherry–histone H2B were infected with lentiviruses expressing shRNAs to ADD1 (sh-ADD1 #1 and #2) or luciferase (sh-Luc). The expression level of ADD1 or actin (as a loading control) was analyzed by immunoblotting (IB) with the indicated antibodies. (B) The cells were stained for DNA, and the percentage of mitotic cells in the total number of cells was measured (n > 2,044). Values (means ± SD) are from three independent experiments. **, P < 0.01. (C) Images of HeLa cells expressing mCherry–histone H2B were acquired by time-lapse epifluorescent microscopy (Axio Observer.D1). Frames were taken every 3 min for 24 h. Arrows indicate misaligned chromosomes. Bar, 5 µm. (D) The defect in chromosome movement caused by ADD1 depletion was classified into three types (see the seventh paragraph in Results and discussion for details). The percentage of each type of defect in the total chromosomal aberrance was measured (n > 25). (E) The duration from chromosome condensation to anaphase onset was measured (n > 25). The results are expressed as box and whisker plots. The horizontal line in each box is the median. The boxes represent 50% of all measurements from the 25th to 75th percentile, and whiskers represent the 10th and 90th percentiles. Values (means ± SD) are from three independent experiments.

