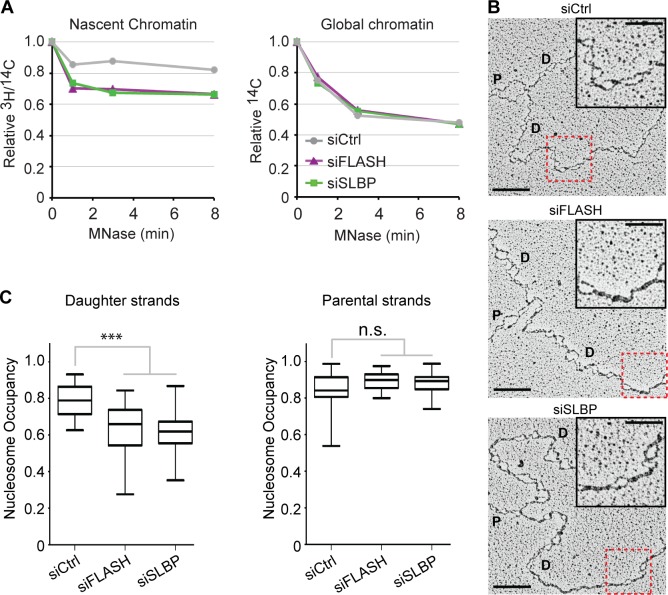
Figure 2.
Low nucleosome occupancy on daughter DNA strands. (A) MNase sensitivity of nascent and global chromatin. Cells prelabeled for one generation with [14C]thymidine were transfected, synchronized to G1/S as in Fig. 1 A, and released for 6 h. Newly synthesized DNA was labeled by a short [3H]thymidine pulse as in Fig. 1 B before nuclei were isolated and subjected to MNase digestion. Relative 3H/14C activity in undigested chromatin is displayed against MNase digestion time. One representative experiment out of two biological replicas is shown. (B and C) Analysis of psoralen–cross-linked replication intermediates by EM. (B) Representative images. P and D annotate parental and daughter strands. Bars: (main images) 200 nm (500 bp); (insets) 100 nm. The red boxes highlight the magnified insets. Full DNA molecules are shown in Fig. S2 C. (C) Nucleosome occupancy on parental and daughter DNA strands. Median is displayed. Boxes are 25–75 percentile ranges, and whiskers are 0–100 percentile ranges. Statistics: two-tailed t test; (left) n ≥ 40; ***, P < 10−3; (right) n > 20; n.s., P > 0.05. siCtrl, siRNA control.

