Figure 8.
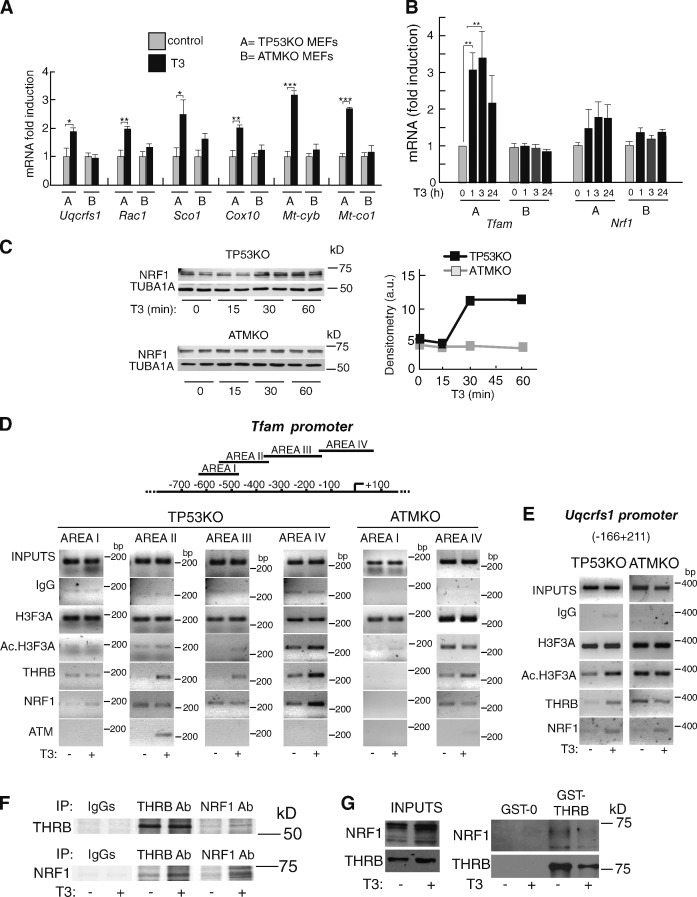
T3 enhances mitochondrial gene expression in MEFs. (A and B) mRNA levels of representative genes of the respiratory chain in TP53KO (A) and ATMKO (B) MEFs incubated with T3 for 1 h. Results are means ± SD (P ≤ 0.0044, n = 3) and are expressed relative to the values obtained in the untreated cells. (B) mRNA levels of TFAM and NRF1 analyzed at 0, 1, 3, and 24 h of T3 treatment (P < 0.0001, n = 3). (C) Western blot of NRF1 in TP53KO and ATMKO MEFs incubated with T3 for the indicated times. TUBA1A was used as a loading control. Densitometry (NRF1/TUBA1A) in arbitrary units (a.u.) is shown on the right. (D) ChIP assays with the indicated antibodies. The depicted areas of the Tfam promoter were amplified in TP53KO cells, and the indicated areas were amplified in ATMKO MEFs. (E) ChIP assays in TP53KO and ATMKO MEFs with the proximal Uqcrfs1 promoter. Cells were treated with and without T3 for 1 h. Ac., acetylated. (F) Coimmunoprecipitation of THRB and NFR1. TP53KO MEFs were labeled in [35S]methionine/cysteine-containing medium for 16 h in the presence or absence of T3 and immunoprecipitated with control IgGs, THRB, or NRF1 antibodies as indicated. IP, immunoprecipitation. (G) GST pull-downs performed with cellular extracts of untreated and T3-treated cells and GST or GST-THRB. The inputs (10%) of the total are also shown. Results are presented as means ± SD. *, P < 0.05; **, P < 0.01; ***, P < 0.001.

