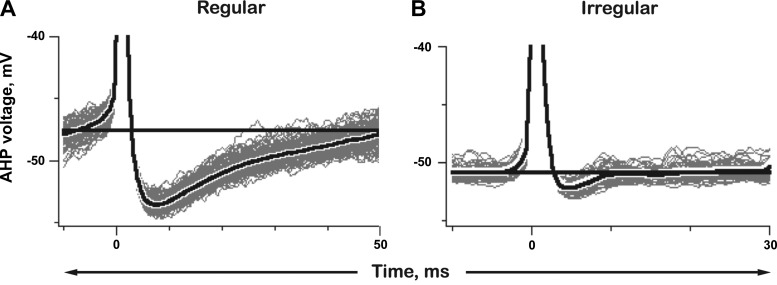
Fig. 3.
Interspike voltage trajectories for the same 2 exemplar units as in Fig. 2; one regular (A), the other irregular (B). AHPs, individual traces (gray) and mean trajectories (black). Horizontal lines, voltages immediately before prepotentials (cf. Figs. 4C and 5C). In the regular unit, the AHP reaches a −6.8 mV peak, 7.4 ms after spike start and takes 50 ms to return to baseline levels. The AHP in the irregular unit peaks at −1.4 mV in 4.6 ms and returns to baseline in <10 ms. AHP hyperpolarizing peak voltage measured from background voltage (horizontal lines); AHP duration measured from spike start to the time when the AHP returns to the background voltage.

