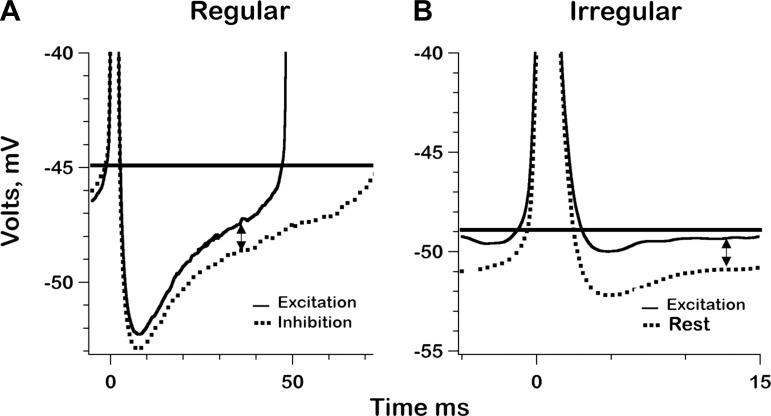
Fig. 7.
Postspike mean voltage trajectories (AHPs) for the 2 exemplar units, one regular (A) and the other irregular (B). In A and B, AHPs are shown for maximal excitation during sinusoidal canal-duct indentation and either maximal inhibition (A) or resting activity (B). Excitation is associated with a depolarization. Spike onset occurs at t = 0; horizontal lines, spike thresholds. Double-headed arrows, time intervals at which 50% of interspike intervals are interrupted by the next spike; this postspike time (PST) is used in Fig. 8 to chart synaptic depolarization as a function of the phase of sinusoidal canal-duct indentations.

