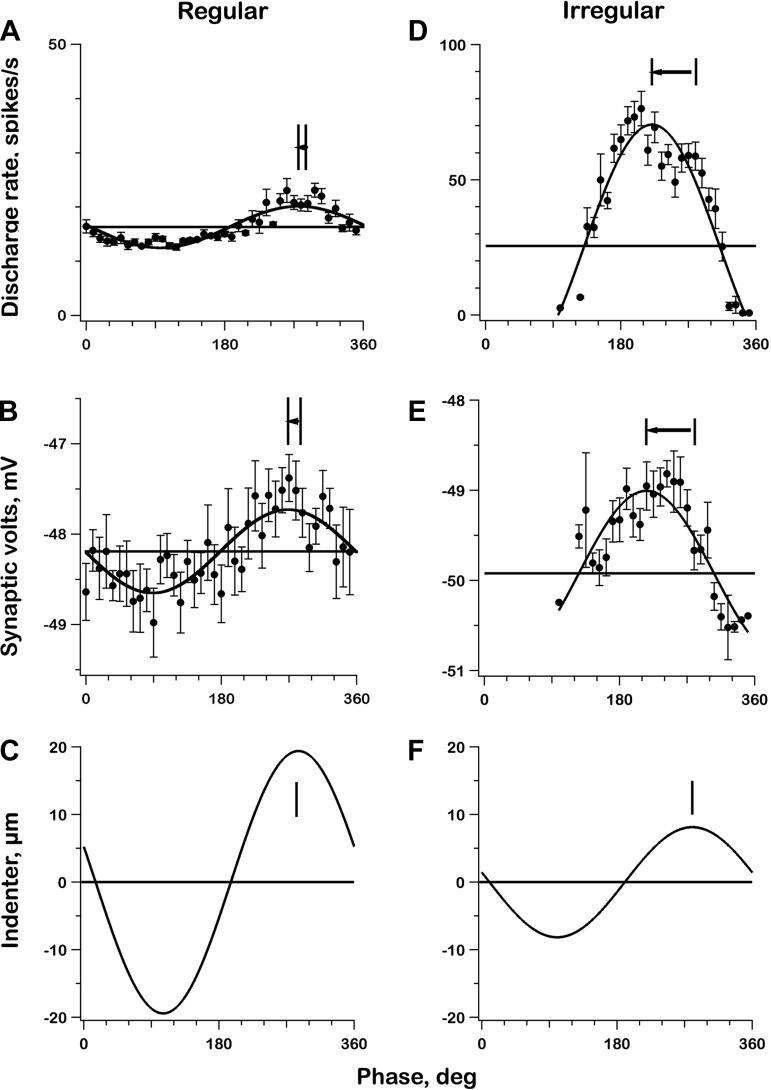
Fig. 8.
Phase plots depicting the responses to 0.3-Hz sinusoidal canal-duct indentations for the 2 exemplar units, one regular (left) and the other irregular (right). Each point, mean value for a bin 9° wide averaged over six consecutive sine-wave cycles; error bars, standard errors. A and D: discharge rates calculated from reciprocal interspike intervals. B and E: mean synaptic depolarization calculated at the PSTs illustrated in Fig. 7. C and F: indenter position, withdrawal (excitation) is positive. No error bars for C and F because variability is negligible. Curves are best-fitting sinusoids of nonempty bins. Vertical lines in C and F are times of maximal excitatory indentation; the same vertical lines are plotted in other graphs along with times of peak responses; arrows depict phase leads re indentation. Compared with the regular unit, spike modulation in the irregular unit is much larger (A vs. D), even though the synaptic voltage modulation is only slightly larger (B vs. E) and indentation is smaller (C vs. F). Spike and voltage phase leads are considerably larger in the irregular unit.

