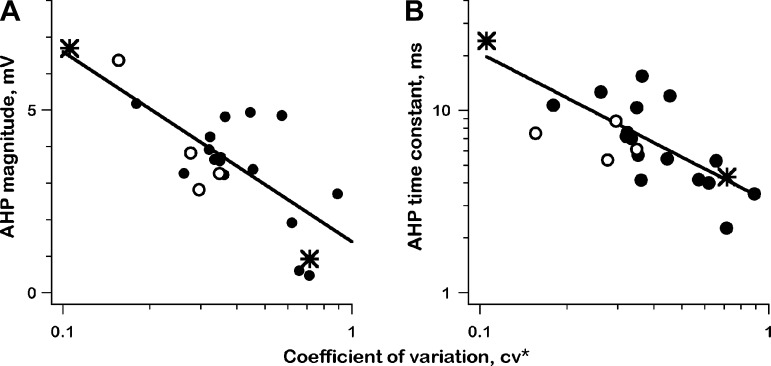
Fig. 9.
Afterhyperpolarization magnitude (A, AHP mag) and time constant (B, AHP tau) are plotted vs. normalized coefficient of variation (CV*) for resting discharge, 22 units; 2 exemplar units (*); 4 units with unreliable qrates (○), >10,000/s. All regressions, df = 20. A: AHP mag vs. log(CV*), t = 5.5, P << 0.001. B: log(AHP tau) vs. log (CV*), t = 4.9, df = 20, P << 0.001.

