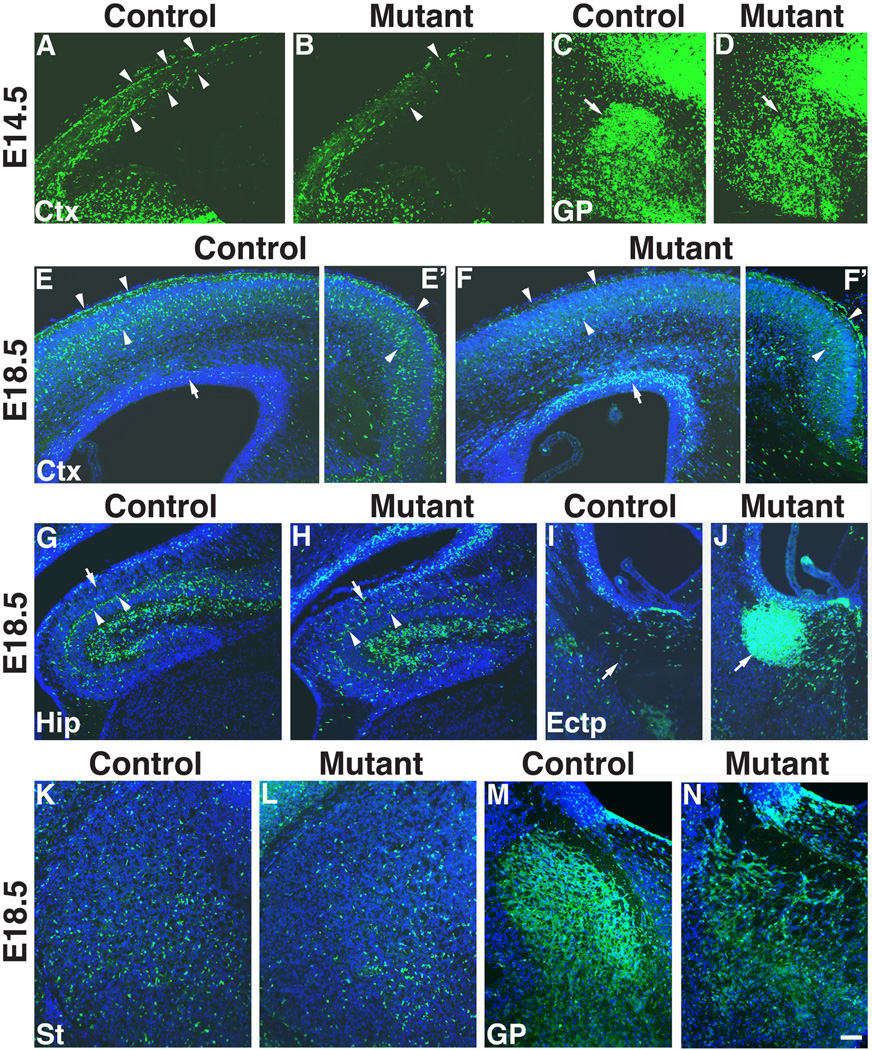
Fig. 8.
Anti-YFP staining shows abnormal distribution of Nkx2.1-lineage (YFP+) cells in the telencephalon of Ldb1 mutant (Ldb1f/−; Nkx2.1-Cre+; R26+/flox-stop-floxYFP) compared to the control (Ldb1f/+; Nkx2.1-Cre+; R26+/flox-stop-floxYFP). At E14.5 (A–D), less YFP+ cells are present in the dorsal cortex (arrowheads) of the mutant (B) as compared to the control (A). The YFP+ cells in the globus pallidus (arrows) are less densely packed in the mutant (D) compared to the control (C). By E18.5 (E–N), in both the lateral (E, F) and the medial (E’, F’) cortex (Ctx), there are less YFP+ cells (indicated by arrowheads) in the superficial layers of the mutant (F, F’) as compared to the control (E, E’). In contrast, more YFP+ cells (indicated by arrows) are present close to the ventricular zone of the cortex in the mutant (F) compared to the control (E). G–H, YFP+ cells are present in the developing hippocampus (Hip) of the Ldb1 mutant, but the cells appear more scatted in the stratum oriens (indicated by arrows) in the mutant (H) as compared to the control (G), in which the cells form a more compact layer adjacent to the pyramidal cell layer (arrowheads). I–J, ectopic (Ectp) YFP+ cells accumulate (indicated by arrows) in the dorsal region of the MGE of the Ldb1 mutant (J) as compared to the control (I). K–L, reduction of YFP+ cells in the striatum (St) of the Ldb1 mutant (L) compared to the control (K). M–N, Disorganization of YFP+ cells in the globus pallidus (GP) of the Ldb1 mutant (N) compared to the control (M). Bar in N represents 114 µm for A–D and 100 µm for E–N.

