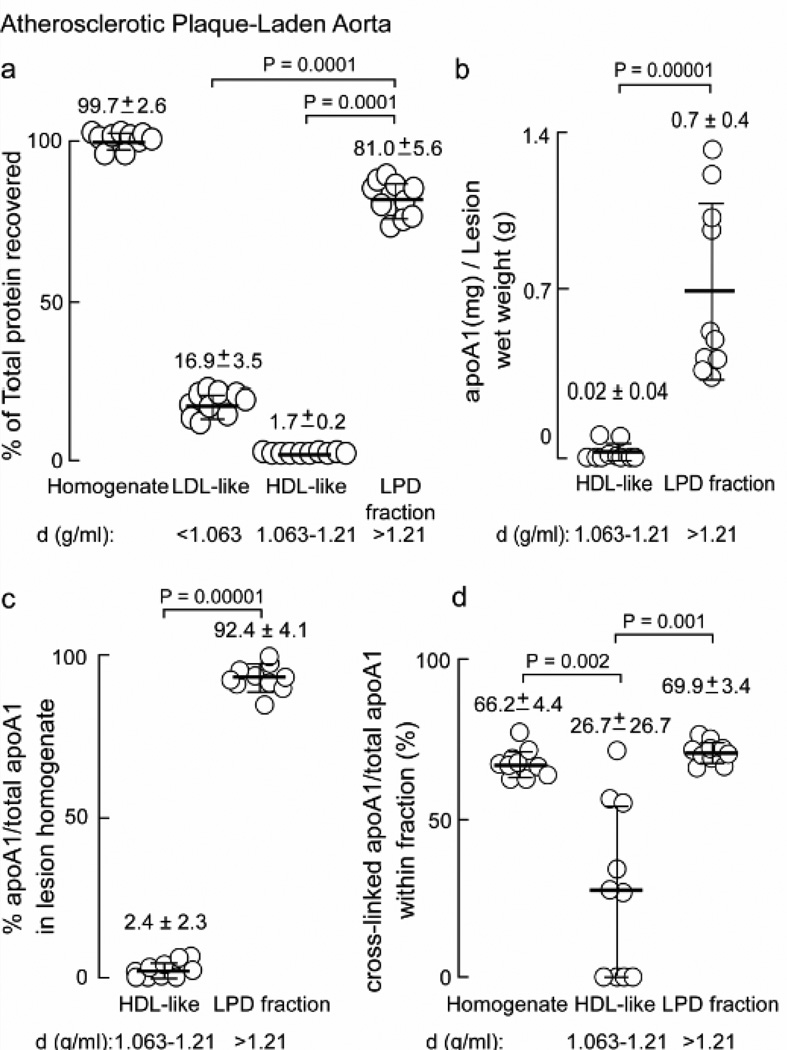
Figure 3.
Particle distribution of apoA1 obtained from human atherosclerotic artery wall. a, Percent of total protein in starting homogenate and in buoyant density ultracentrifugation fractions LDL-like, HDL-like and LPD determined by BCA protein assay are indicted. b, ApoA1 (mg) recovered per gram of lesion tissue (wet weight) in the HDL-like and LPD fractions; c, percent apoA1 to total apoA1 from atherosclerotic lesion homogenate present in the HDL-like and LPD fractions; d, cross-linked apoA1/total apoA1 within each fraction as a percentage was determined by quantitative western blot analysis of apoA1 immuno-reactive bands in Figure 2b and additional blots (not shown). Values were determined from samples (n=10), error bars represent S.D. Mean values are indicated by a heavy horizontal line. Kruskal-Wallis test was used in panels (a) and (d) and found to be significant (P=0.0001 and P=0.0003 respectively). Dunn’s test was used to adjust for multiple comparisons and Wilcoxon Rank Sum test was used in pairwise comparisons. Actual P values are listed when P<0.05.

