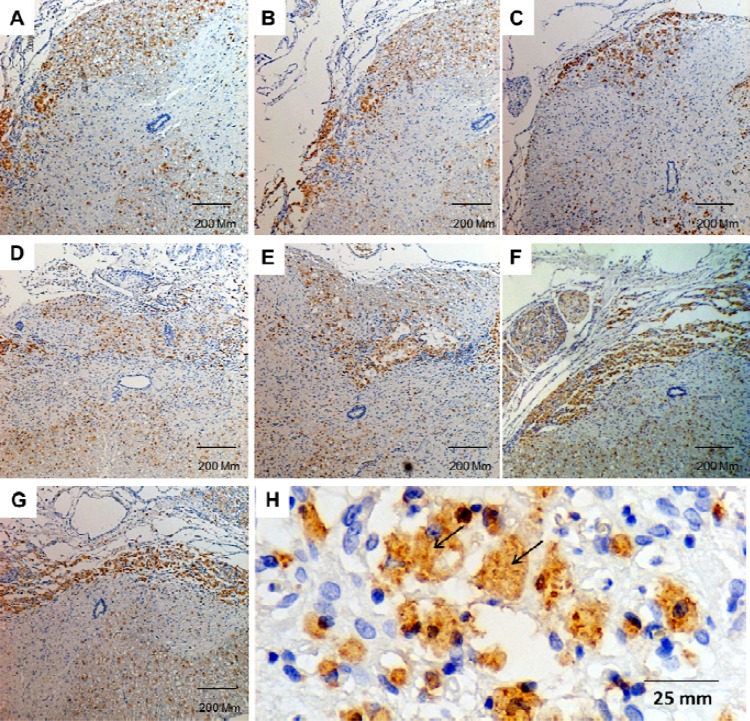
Fig. 1.
ED-1 immunoreactivity in the lesion site of a contused spinal cord at various time points. (A–G) represent photomicrographs showing an increase in the density of ED-1 positive cells at day 1 (A), day 2 (B), day 4 (C), week 1 (D), week 2 (E), week 3 (F), and week 4 (G) after SCI; (H) represents ED-1 positive cells. Brown colors represent the immunopositive site, whereas blue colors represent hematoxylin staining. Black arrows indicate ED-1 immunoreactive cells

