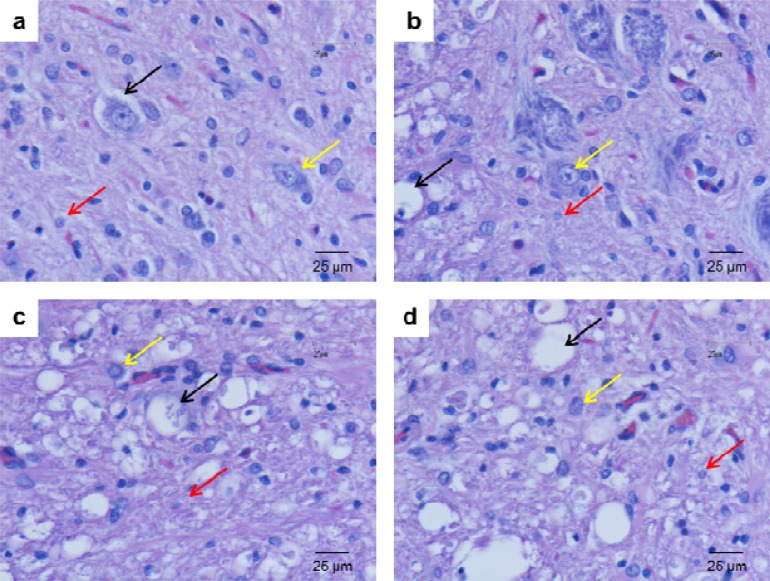
Fig. 3.
Photomicrographs of the ventral horn of the contused spinal cord stained with routine stains (H & E). Glial cell density was evaluated at week 1 (A), week 2 (B), week 3 (C), and week 4 (D) after injury. Black, red, and yellow arrows represent vacuolization of dead cells, glial cells, and motor neuron, respectively

