
Figure 4.
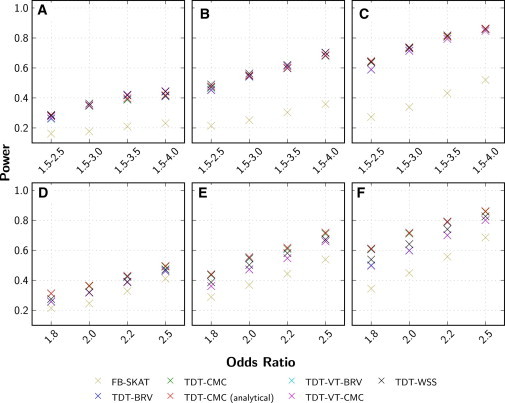
Comparison of Power for the RV-TDT Methods and FB-SKAT
Power was evaluated for an α level of 0.05 for 1,500 trios by generating 2,000 replicates. Analysis was performed with TDT-BRV, TDT-CMC, TDT-VT-BRV, TDT-VT-CMC, TDT-WSS, and FB-SKAT. For the TDT-CMC, TDT-BRV, and FB-SKAT, variants with a MAF ≤ 1% were analyzed while for the TDT-VT-BRV, TDT-VT-CMC, and TDT-WSS, variants with MAF ≤ 5% were analyzed. For the TDT-BRV, TDT-CMC, TDT-VT-BRV, TDT-VT-CMC, and TDT-WSS, p values were obtained empirically by performing 2,000 haplotype permutations for each replicate. For the TDT-CMC, p values were also obtained analytically. For the FB-SKAT, p values were obtained with a moment matching approach by using 10,000 Monte Carlo simulations. Genetic variant data were generated under the Kryukov model and the proband’s affection status was obtained with two different penetrance models: variable-effects model (A, B, C) and equal-effect model (D, E, F). Different proportions of the variant sites were deemed to be causal: (A and D) 50%, (B and E) 75%, and (C and F) 100%.