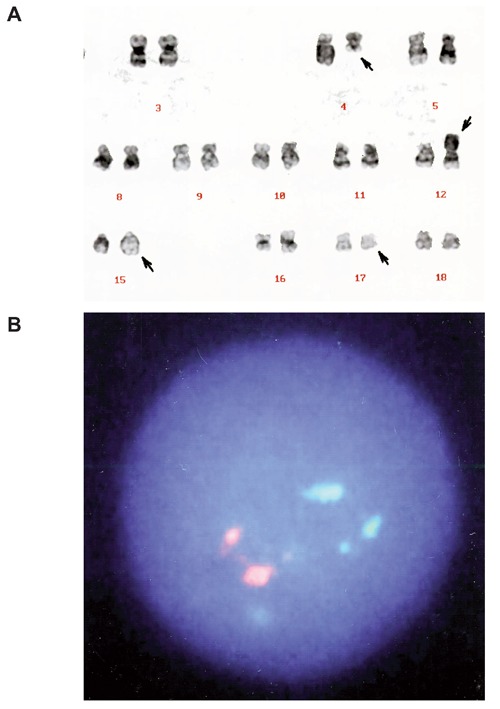
Figure 2.

A) G-banded karyotype of the bone marrow cells showing t(4;12)(q21;p11) and t(15;17)(q22;q21). Arrows indicate the derivative chromosomes. B) FISH analysis with PML/RARα-specific probes showing two orange (PML) and two green (RARα) signals. No PML/RARα fusion signal (which should appear yellow) was detected.
