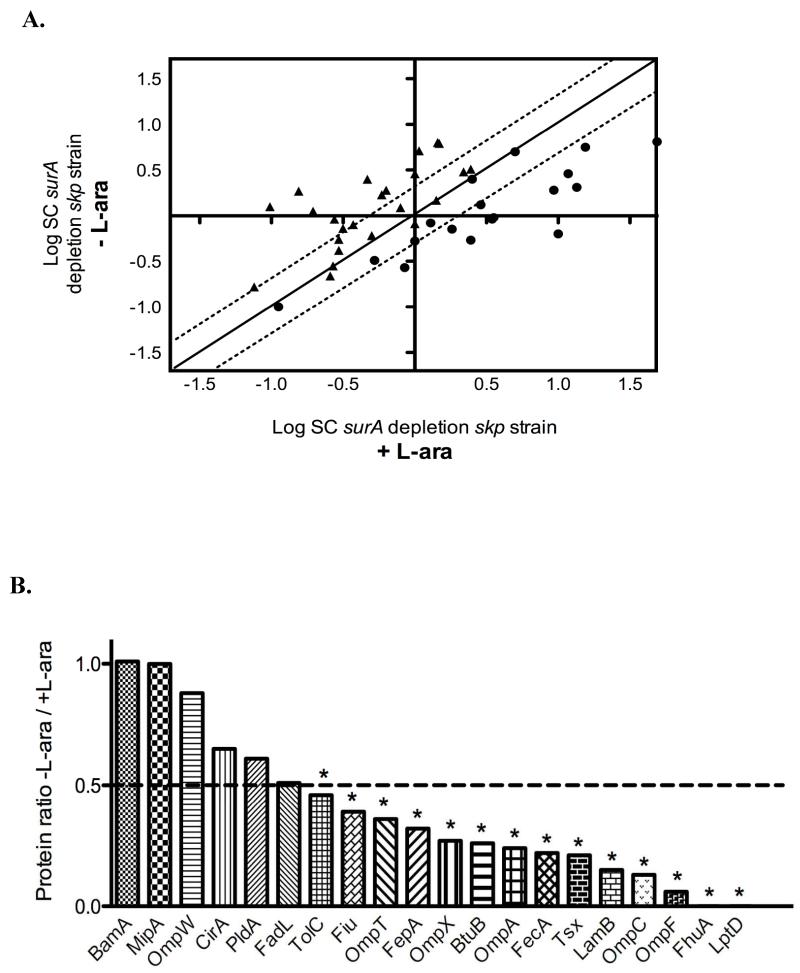
Figure 3. The loss of SurA and Skp has a severe impact on the OM proteome.
A. Two-dimensional logarithmic plot for the mean SC values of the identified lipoproteins and β-barrel proteins from the surA depletion skp strain grown in the presence or absence of L-arabinose. Spots on the diagonal and between the two dotted lines correspond to proteins that are not significantly affected by the depletion of SurA (they differ in their SC values by a factor of less than 2). Spots that are above the upper dotted line or below the lower dotted line correspond to proteins whose abundance is increased or decreased by more than two fold in the surA depletion skp strain, respectively. Closed circles (●) correspond to β-barrel proteins and closed triangles (▴) to lipoproteins. B. Ratio of OM proteins calculated by considering that SC values obtained for proteins from the surA depletion skp strain grown with L-arabinose are equal to 1. SurA depletion in the surA depletion skp strain leads to a significant decrease (more than two fold) in the abundance of 14 β-barrel proteins. The OM proteins for which the decrease is statistically significant (p< 0.05) are indicated by an asterisk.

