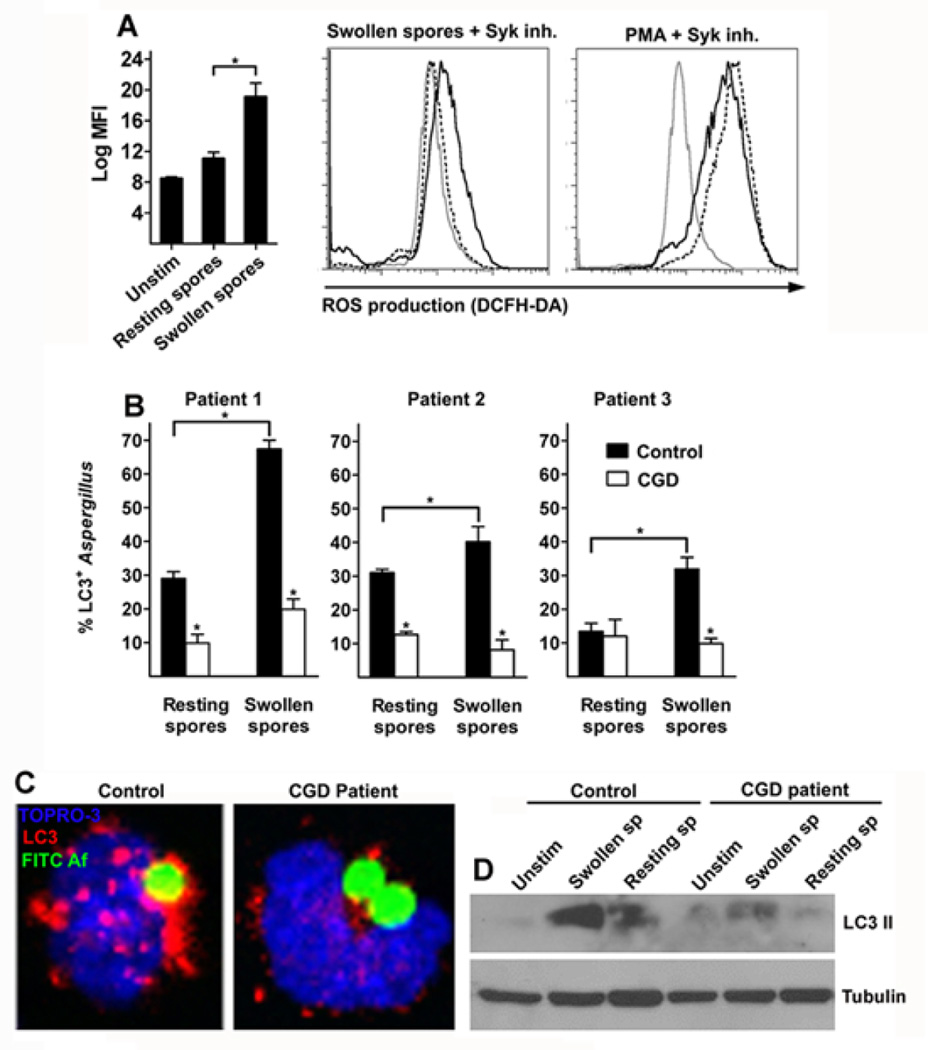
Figure 4. Syk kinase dependent ROS production regulates formation of LC3+ Aspergillus containing phagosomes.
A. Primary human monocytes (2 × 10⁵ cells/condition) were left unstimulated or infected with resting spores or swollen spores of A. fumigatus at a MOI of 5:1 with or without 30 min pretreatment with syk inhibitor (1 µM) or stimulated with PMA (100 ng/ml) with or without 30 min pretreatment with syk inhibitor (1 µM) for 1h at 37 °C. DCFH-DA was added during the last 30 min of stimulation and intracellular ROS production was determined by measurement of relative fluorescent intensity at the FL1 channel (log MFI). Differences in ROS production between experimental groups were quantified and data are presented as mean + S.E.M. from 4 independent experiments. *, P < 0.005, paired Student’s t test. Representative FL1 histograms from human monocytes left untreated (gray solid line), stimulated with either swollen spores of A. fumigatus alone or PMA alone (black solid line) or in the presence of syk inhibitor (black dashed lines) are shown. B-C. Primary human monocytes (2 × 10⁵ cells/condition) isolated from CGD patients and healthy controls were infected with FITC-labeled resting or swollen spores of A. fumigatus at a MOI 5: 1 for 1h at 37 °C. Cells were fixed, permeabilized, and stained for LC3 II as in Figure 1A. The percentages of LC3+A. fumigatus-containing phagosomes (LC3+Aspergillus; n > 100 per group) were quantified and data are presented as mean + S.D. for each patient. *, P < 0.0001, paired Student’s t test. Representative immunofluorescence image of LC3+ phagosomes containing FITC-labeled swollen spores of A. fumigatus in monocytes obtained from healthy control and CGD patient. D. Primary human monocytes (1 × 10⁶ cells/condition) from a representative CGD patient and the corresponding healthy control were left untreated (unsitm) or stimulated with resting spores or swollen spores of A. fumigatus at a MOI 10:1 for 1h at 37 °C and levels of LC3 II and tubulin were determined in cellular lysates by immunoblotting.

