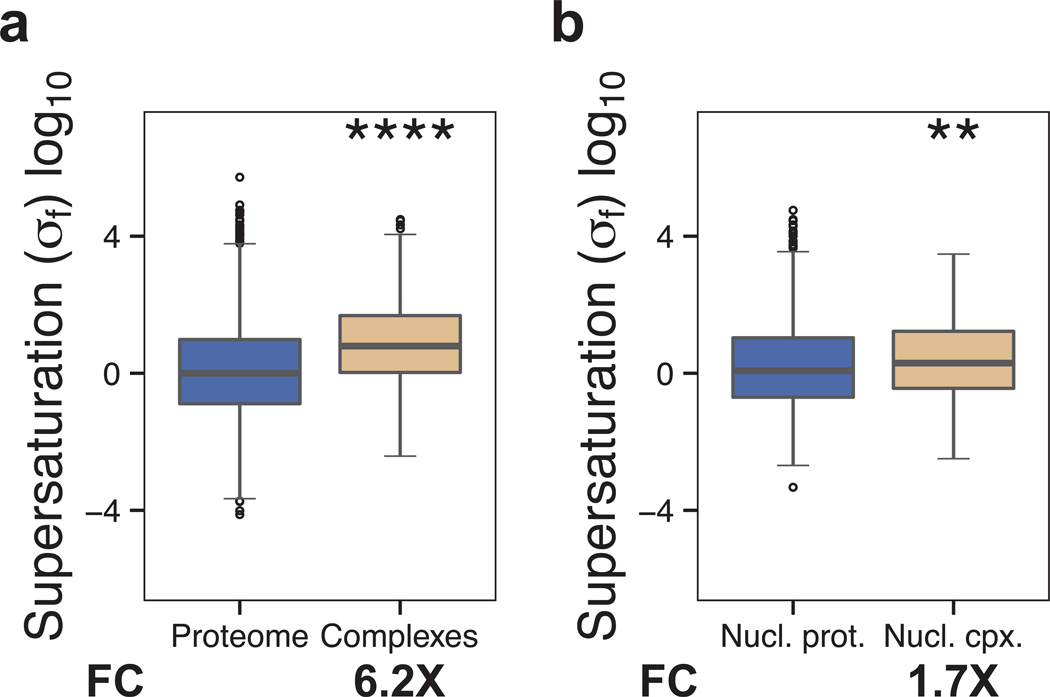
Figure 5. Proteins that form complexes tend to be more supersaturated than the proteome as a whole.
We compared the σf scores for: (a) the proteome and proteins involved in complexes, and (b) the nuclear proteome and proteins involved in nuclear complexes. Boxplots extend from the lower to the upper quartiles, with the internal lines refer to the median values. Whiskers range from the lowest to highest value data points within 150% of the interquartile ranges. The statistical significance was assessed by Wilcoxon/Mann-Whitney U test with the Bonferroni-corrected p-values (*p < 0.05, **p < 0.01, ***p < 0.001, ****p < 0.0001).

