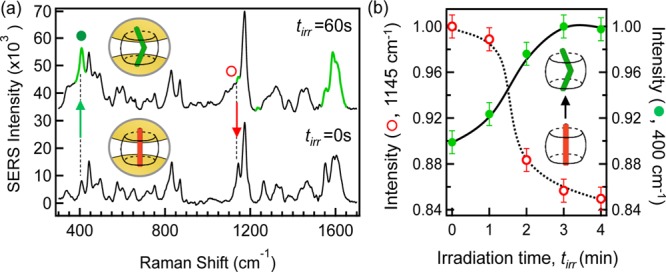
Figure 3.

(a) SERS spectra of DAS ⊂ CB[7]:AuNP nanocluster solution before (tirr = 0 s, trans-) and after (tirr = 60 s, cis-) UV irradiation (λ = 355 nm). Highlighted modes (green, tirr = 60 s) indicate significant amplitude changes following photoisomerization. Complexed DAS concentration 1 nM. Spectra offset and background subtracted for clarity. (b) Time-resolved normalized SERS intensity of characteristic modes for the reactant trans-DAS (○) and product cis-DAS (●) identified in (a) following subsequent photoirradiation. Solid and dashed lines guide the eye.
