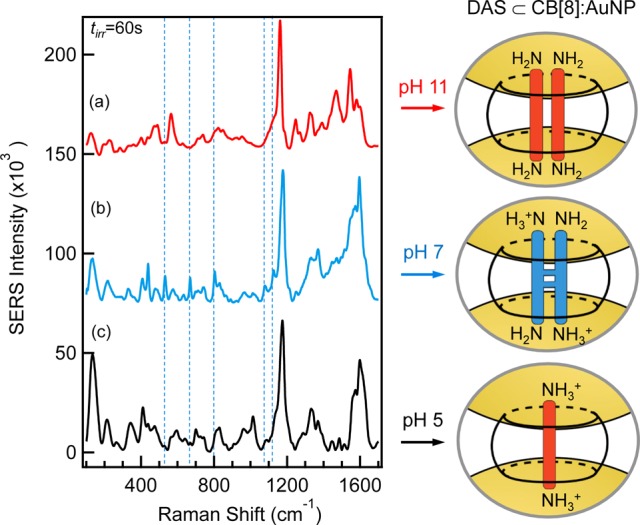
Figure 4.

SERS intensity of DAS ⊂ CB[8]:AuNP post photoirradiation for three different pH: (a) 11, (b) 7, and (c) 5. Dashed lines guide the eye for the signature photocycle product modes. Spectra offset for clarity. Also shown are schematic illustrations of the DAS ⊂ CB[8] nanocluster particle junctions. The amine groups of the complexed DAS experience varying levels of protonation as a function of pH.
