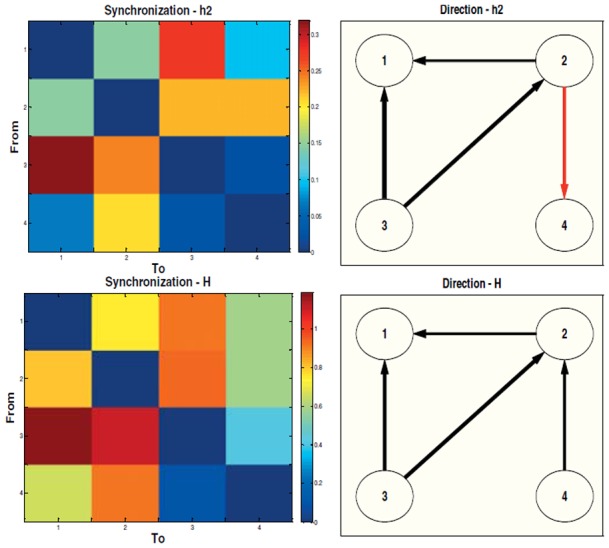
Fig. 2.

Quantity (left) and direction (right) of information flow using Top: nonlinear correlation coefficient method (h2) applied to the synthetic signal. The red arrow between nodes 2 and 4 indicates erroneous direction detection. Bottom: the index of general synchronization method (H) applied to the synthetic signal.
