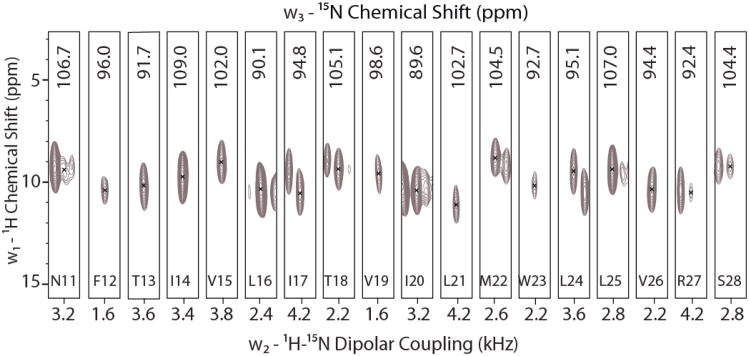
Fig. 2.
Strip plot of the 3D-SE-PISEMAI-HETCOR spectrum. All resonances from N11 to S28 are completely resolved and assigned based on our previous assignment for the 2D spectrum. Average signal is 55σ (range of 24σ-124σ). Spectrum is plotted starting at 18σ with contours progressing by factor of 1.2.

