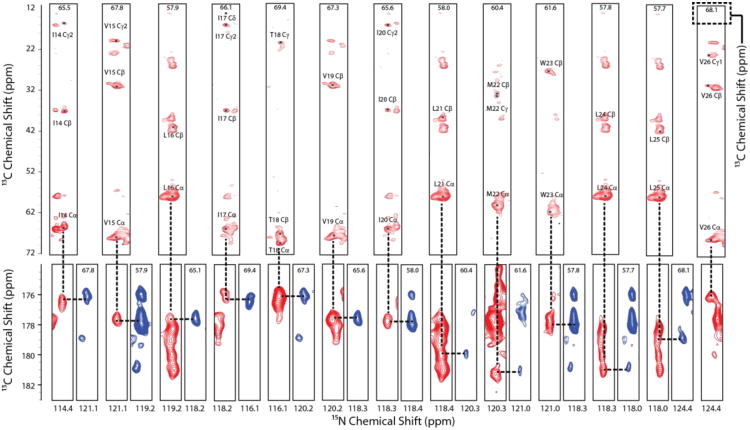
Fig. 4.
Strip plots from the 3D-DUMAS-NCACX (red)/CANCO (blue) experiment. NCACX spectrum is plotted starting at 12σ (Cα-Cβ region) and 8.5σ (C region) and contours progressing by a factor of 1.1. Average signal per residue for NCACX is 28σ (Cα-Cβ region, range 12σ-63σ) and 15σ (carbonyl region, range 9σ to 25σ). CANCO spectrum is plotted starting at 6σ and contours progressing by a factor 1.1. The average signal for per residue is 10σ (range 7σ to 20σ). The average linewidth in each spectrum is ∼1.1 ppm for 13Cα (indirect dimension), 1.0ppm 13C (direct dimension) and 2.5ppm for 15N (indirect dimension)

