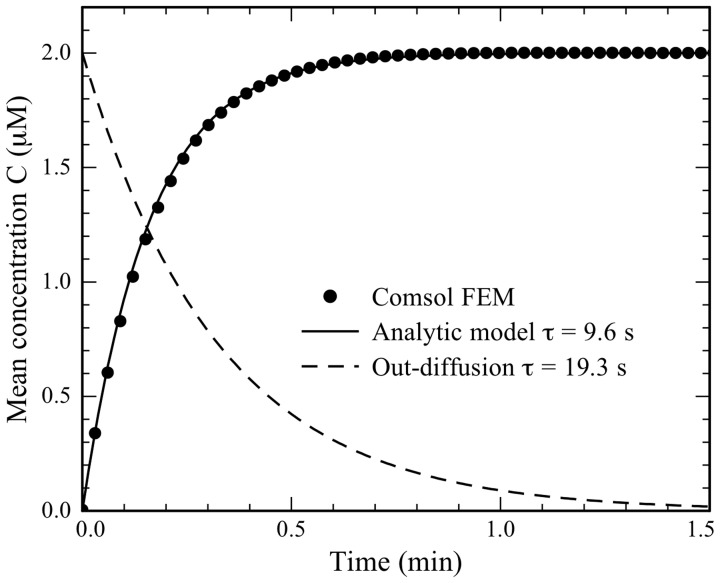
Figure 3.
The average concentration of MBs in the cell as a function of transfection time. Results from a COMSOL FEM model (dots) are compared to the analytical model (black line) with the time constant τc = 9.6 s. The average concentration in the outdiffusion experiment calculated from the analytic model is shown as the dashed curve using the time constant τo = 19.3 s.

