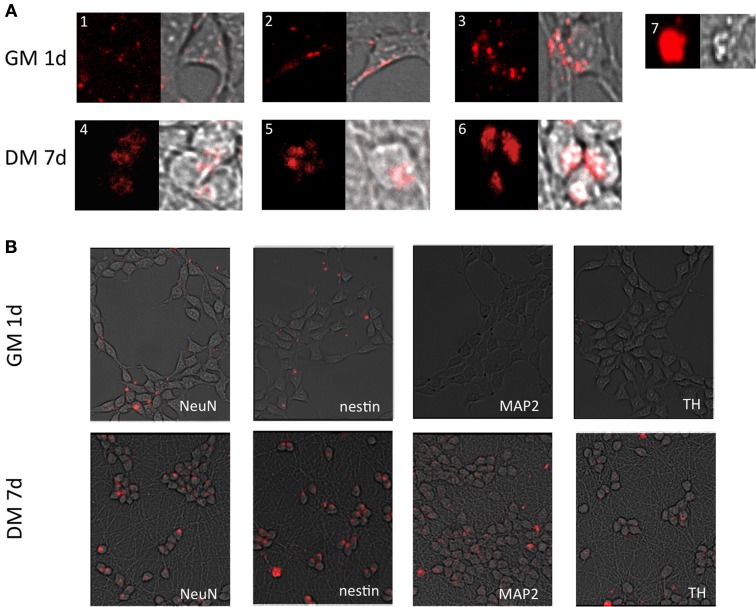
Figure 4.
Fluorescent images of cells transfected with MBs. (A). Different MB signal patterns observed in LUHMES cells grown in GM 1 day after transfection (A1–3) and 7 days post induction of differentiation (A4–6). (A7) shows large bright fluorescent clusters originating from apoptotic cells (artifact). These cells were excluded from calculations of the number of positive cells and signal intensity. (B) Signals (red) from the respective MBs—SOX2, nestin, NeuN, MAP2, TH from a population of cells. Please see Supplementary information S2 outline of the experiments.

