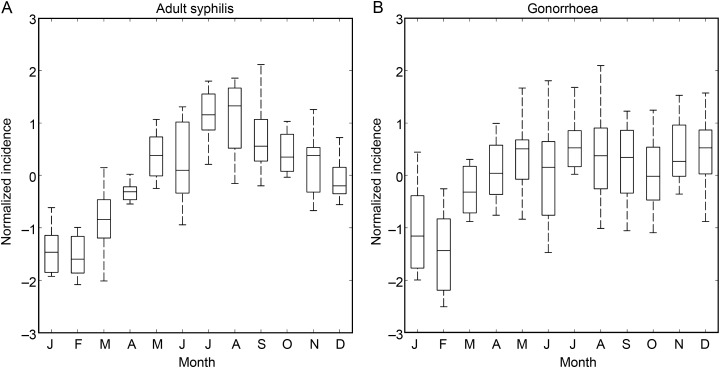
Figure 2.
Annual overlay of the incidence of adult syphilis (A) and gonorrhea (B) from 1996 through 2007 in Guangdong Province. The middle red line represents the mean disease incidence, the upper and lower ends of the box represents the 95% confidence interval, and the upper and lower lines represent the maximum and minimum disease incidence.

